Guides · Examples added 9 September 2026; comparison dates below
The best free portfolio tracker in 2026
If "free" must mean everything, it is Portfolio Performance: open source, nothing held back, a file on your own disk. If it must be a modern dashboard with analytics and an assistant that reads your actual holdings — explaining any metric on your own numbers, filtering the table from a sentence, looking up any company's news and earnings — our pick is Fortunest's free plan: no account, no card, three accounts and fifty assets. Ghostfolio is unlimited if you host it yourself.
The short answer
- Free with nothing held back: Portfolio Performance — a desktop program for Windows, macOS and Linux, no account, no service, the whole product. You do the importing and the maintenance.
- Our pick for a free dashboard: Fortunest — the whole dashboard, Explore, simulations, trade recommendations and the full assistant, which reads your holdings and your screen, explains any figure on your own numbers and drives the dashboard — with these Free size limits: 3 accounts, 50 assets, 3 watchlists and 20 watched assets. No account, no card.
- Free if you self-host: Ghostfolio — AGPL-licensed and unlimited on your own Docker host; the cloud free tier is a summary, allocations and benchmarks.
- Most connections on a free plan: getquin — 0 €/year with unlimited bank and broker connections and real-time data; the analysis features start at €89.99 a year.
- Most holdings on a hosted free plan: Parqet Basis — €0 for one portfolio with unlimited securities holdings and five other asset types.
Free plans are capped in one of four ways
Reading a pricing page for what the free tier includes is the wrong way round. What matters is the cap, and there are only four kinds. A size cap limits how much portfolio fits — ten holdings at Sharesight and Snowball, fifty assets across three accounts at Fortunest, one portfolio at Parqet. A feature cap gives you the whole portfolio but takes the analysis away: getquin's free plan connects everything and then puts AI analysis, dividend forecasting and advanced performance analytics on Premium. An automation cap lets you type but not sync — Parqet's autosync, AllInvestView's broker linking and Snowball's higher tiers all work this way. And a work cap is the open-source bargain: Portfolio Performance and a self-hosted Ghostfolio hold nothing back and charge you in evenings instead.
The reason to know which cap you are under is that only one of them gets worse over time. A feature cap is the same on day one and in year five. A size cap tightens as you invest — ten holdings is a starter portfolio, and hitting the ceiling in year two means either paying or migrating with two years of history in tow. Before choosing, count the positions you expect in three years, not the ones you have.
Two more things worth checking on any free plan, because they are rarely on the pricing page. Does it need an account, and does it need a card? Only Portfolio Performance and Fortunest's free plan need neither; Ghostfolio's anonymous token is close. And where does the free tier put your data — a file on your machine, a European host, or a US host that discloses to advertising partners? A free plan you pay for in data is still a price, and the privacy-first guide takes that question further. If what you want free is specifically the assistant, the AI tracker guide compares those.
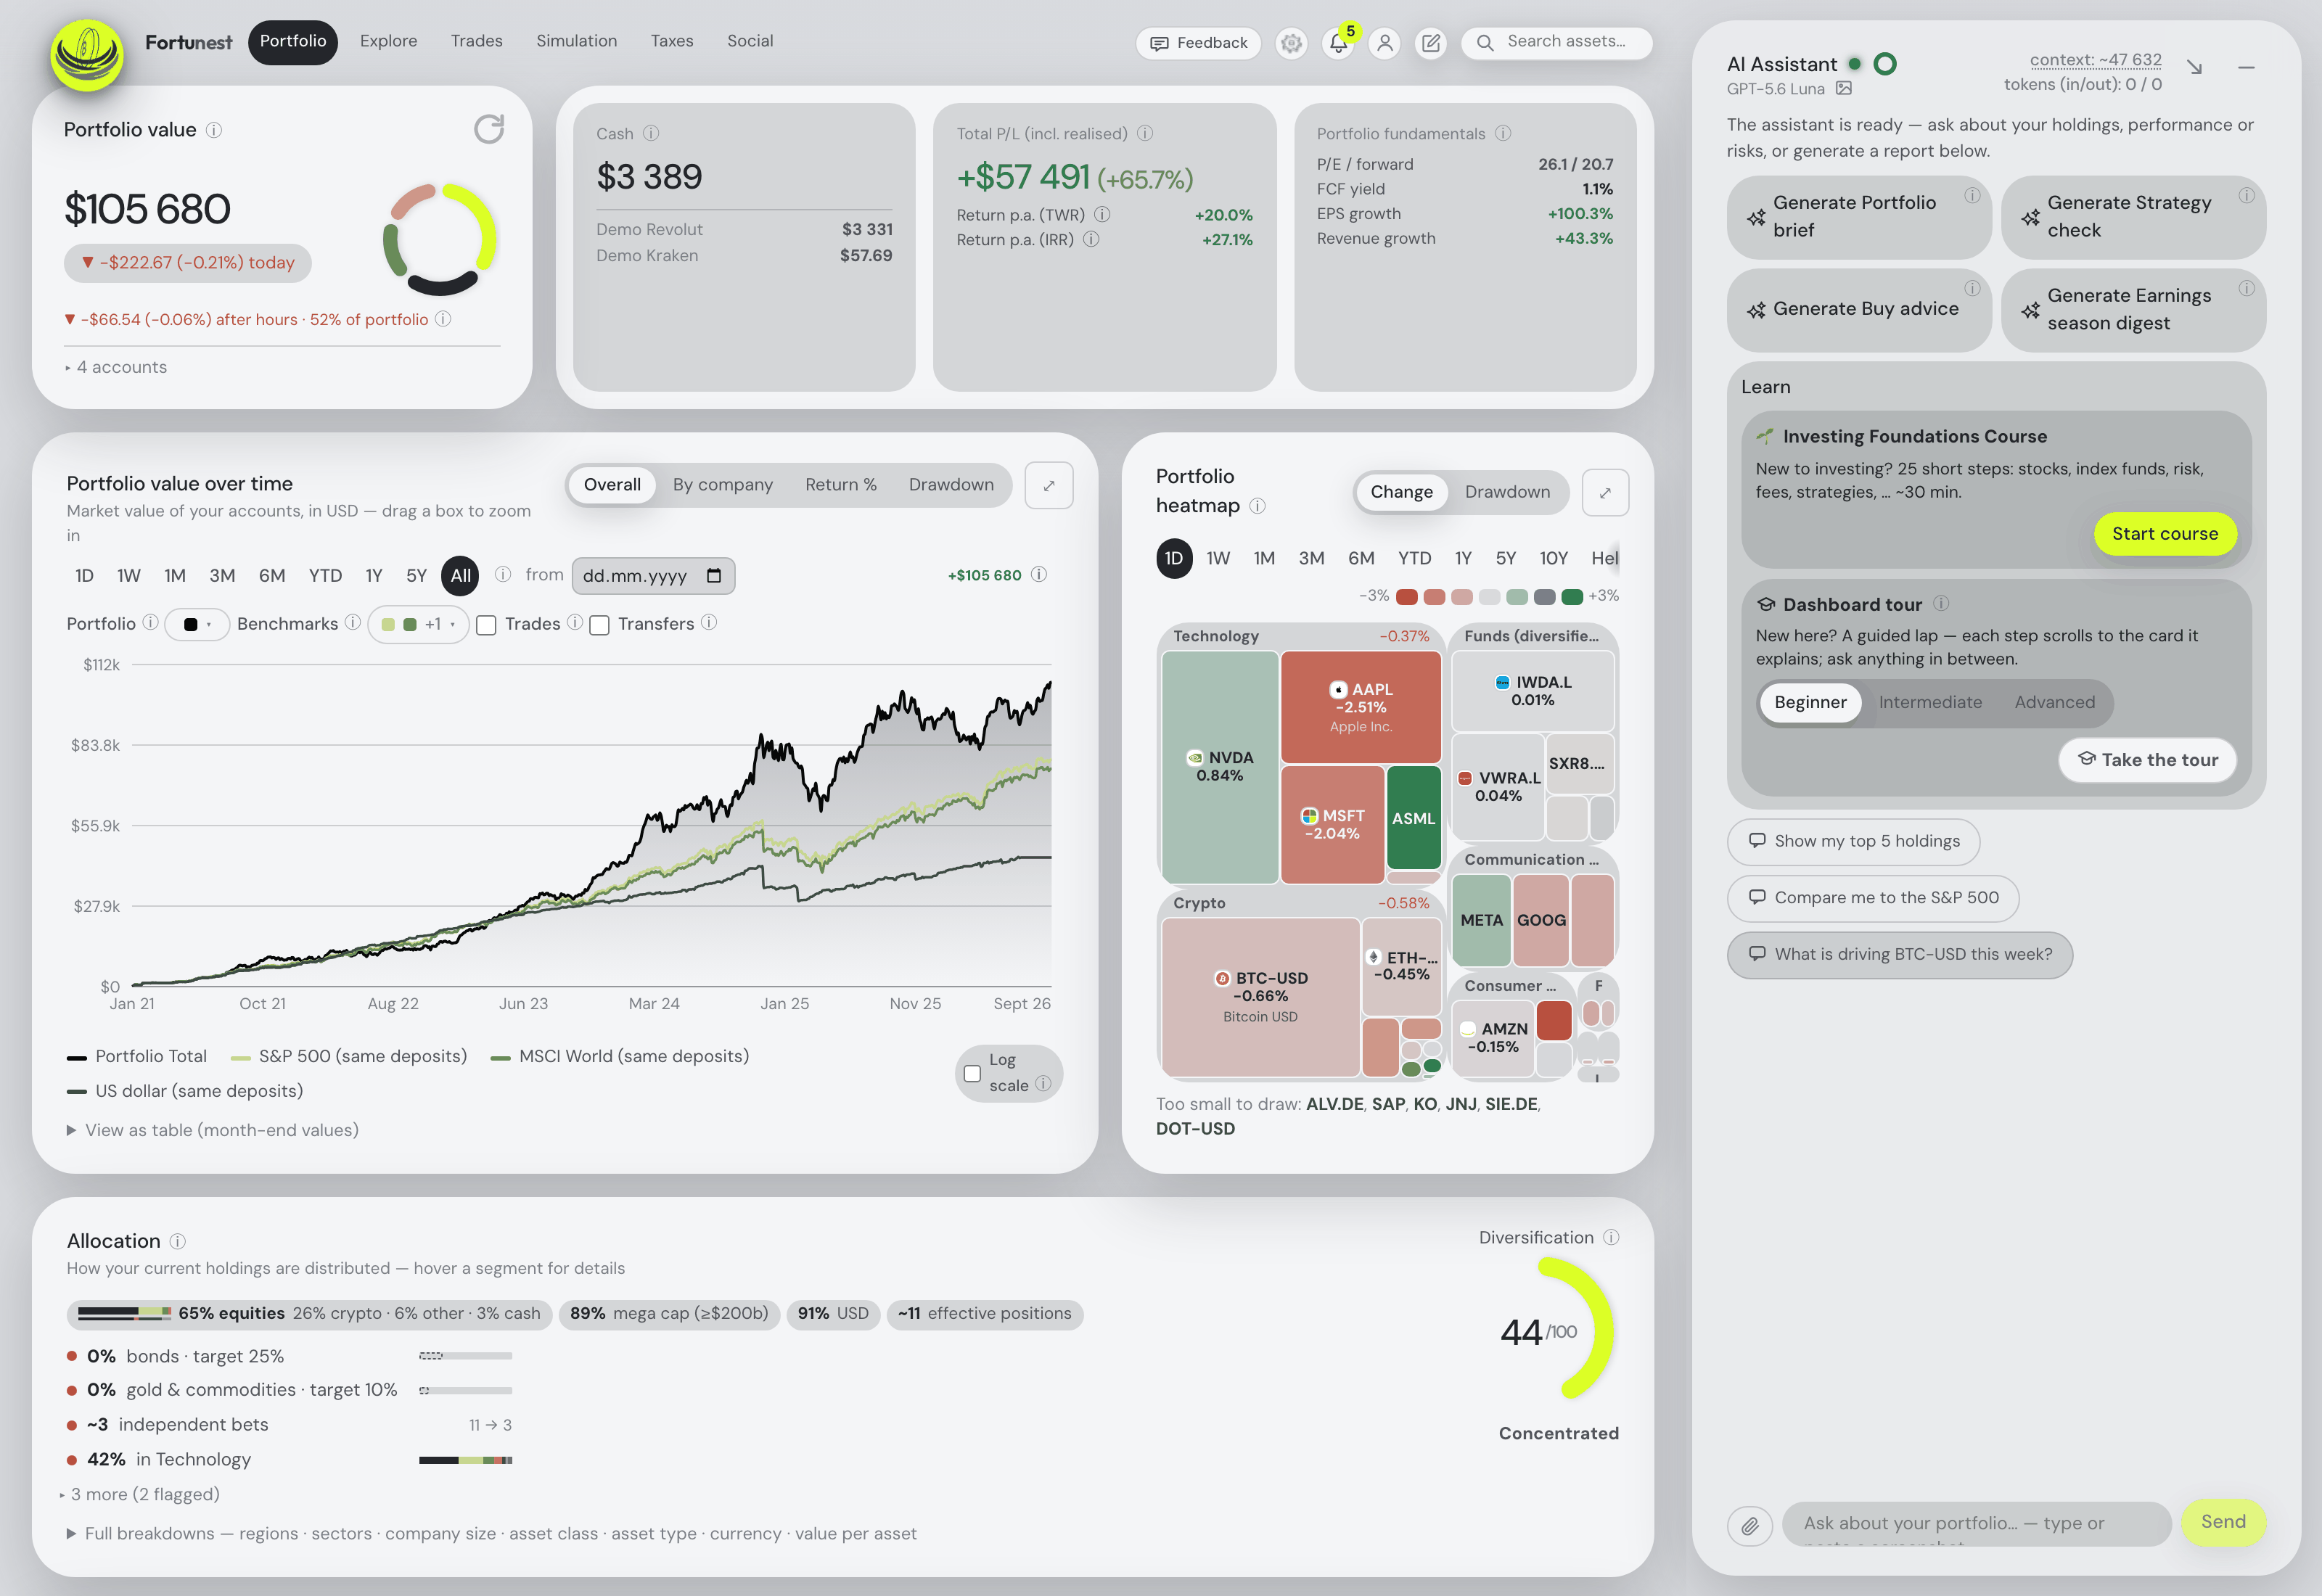
Try the Free workflow before importing
- Open Fortunest in an empty guest session and select Try with demo data. Use a separate browser profile if your usual guest session contains your own portfolio.
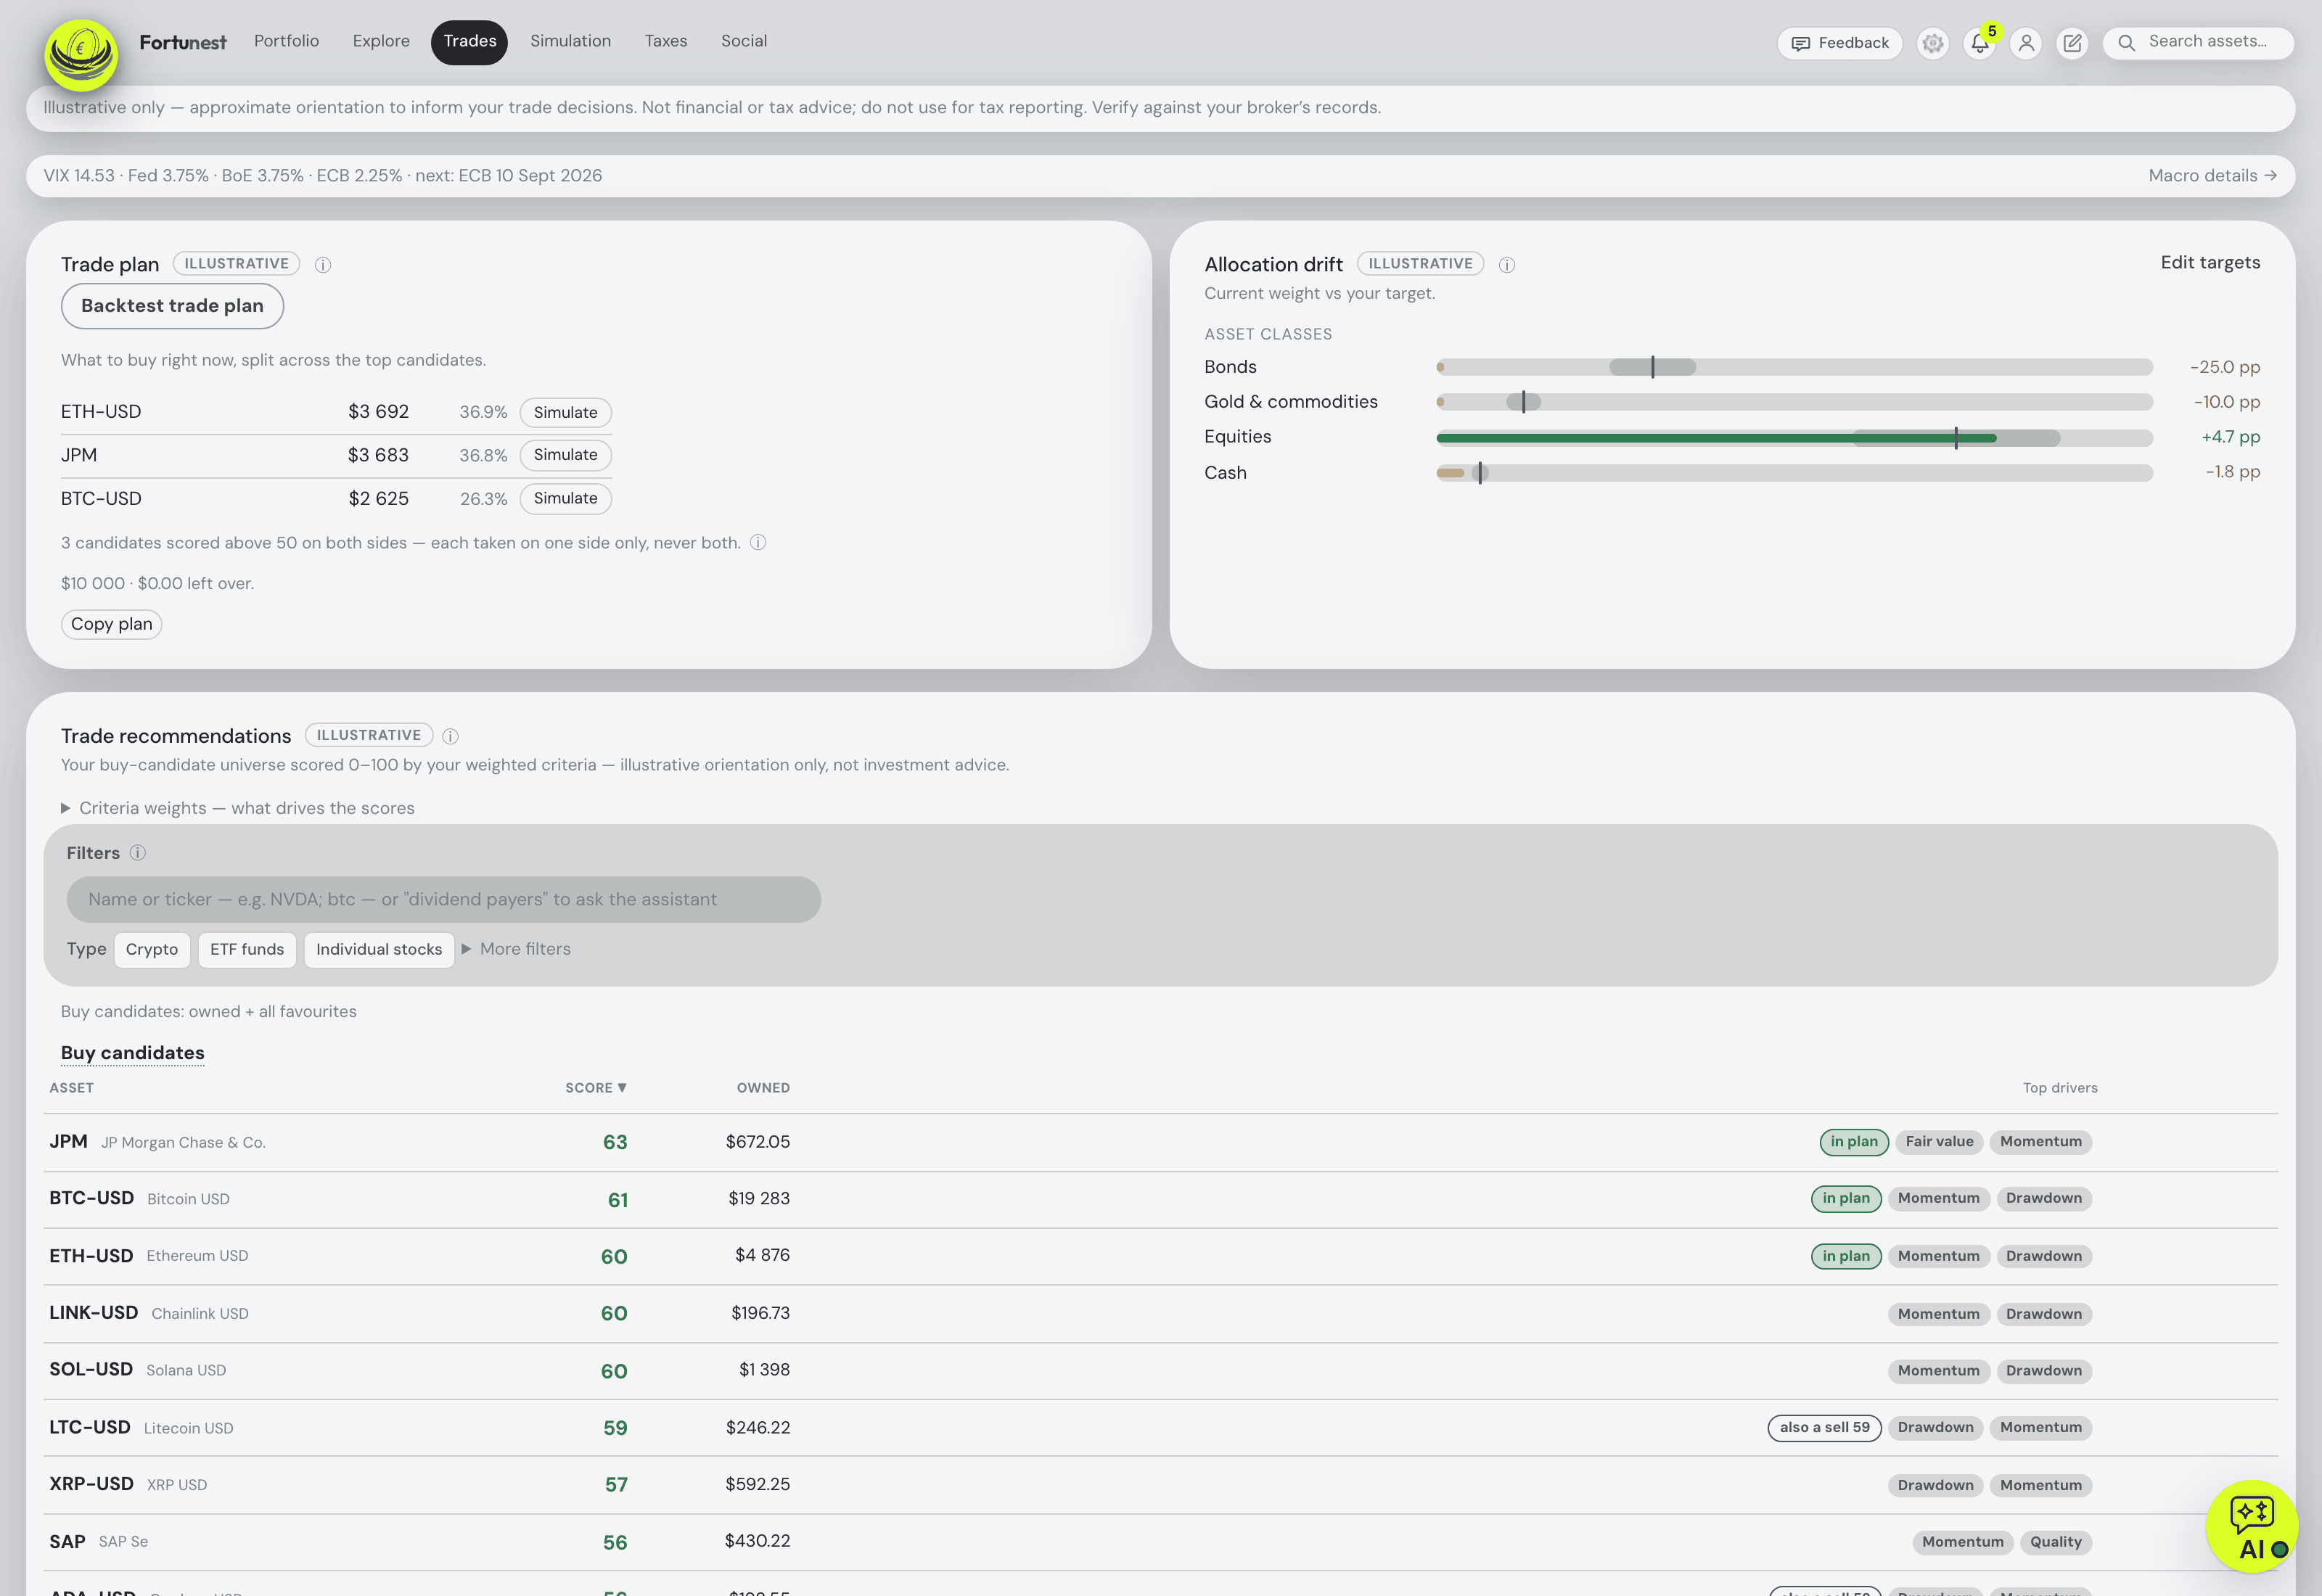
- Inspect holdings and performance, then open Trades → Backtest trade plan for a Free historical replay with the same deposits and withdrawals.
- Use the in-app assistant within its metered hosted budget, your own provider key or a configured local model. External-agent connections through MCP are Pro.
- Before importing your own holdings, check the Free caps: 3 accounts and 50 assets. Social needs an account; Free follows two investors, while investor-group analytics require Pro.
Guest mode uses a hosted session with a 12-hour idle expiry plus a browser backup, not browser-only storage. Keep your original imports and read the guest recovery and storage limits. The built-in demo can exceed ordinary Free caps; it is a sample dataset, not an increased personal allowance.
The comparison
Every cell describes the free tier unless it says otherwise, as the vendor's own pages state it on the date in the footnote. A green ✓ marks whichever product leads a row on that row's own terms — sometimes ours, often not.
| Fortunest1 | Portfolio Performance2 | Ghostfolio3 | getquin4 | Parqet5 | Sharesight6 | Snowball7 | Yahoo Finance8 | |
|---|---|---|---|---|---|---|---|---|
| What the free tier is |
|
|
|
|
|
|
|
|
| Account & card |
|
|
|
|
|
|
|
|
| Cap on holdings |
|
|
|
|
|
|
|
|
| Accounts, portfolios, watchlists |
|
|
|
|
|
|
|
|
| Getting data in, free |
|
|
|
|
|
|
|
|
| Returns, risk & benchmarks |
|
|
|
|
|
|
|
|
| AI on the free plan |
|
|
|
|
|
|
|
|
| Dividends & monitoring |
|
|
|
|
|
|
|
|
| Tax on the free plan |
|
|
|
|
|
|
|
|
| Where your data lives |
|
|
|
|
|
|
|
|
| First paid step |
|
|
|
|
|
|
|
|
Cells were checked against the sources below on 7 September 2026; Portfolio Performance's, Ghostfolio's, Sharesight's and Snowball's non-pricing rows come from their pages as read on 19 August 2026. Prices are each vendor's list price and, for Fortunest, before VAT. "Not described" is a statement about those pages on that date, not about the product.
The verdicts
Portfolio Performance
Best for: free meaning free — the whole product, no account, no upsell.
Free — EPL 1.0
The reference tool for European DIY investors for a decade, and the only entry here with no commercial tier to be nudged towards. A desktop program on Windows, macOS and Linux keeps your portfolio in a file you back up yourself; it imports CSV and PDF statements, benchmarks against an index, reports volatility, semivariance and maximum drawdown, and rebalances to your target allocation, with exchange rates taken from the European Central Bank back to 1999.
Where it falls short: the price is your time — imports, fixes and backups are yours; there is no phone app, no projection, no tax report and no assistant; and price lookups still go out to data providers.
Fortunest — our pick for a free dashboard
Best for: a full analytics dashboard, and an assistant, without an account or a card.
Free · Pro €6.99/mo or €69/yr
The Free dashboard has these size limits: 3 accounts (CSV files and broker connections), 50 assets in total, 3 watchlists with 20 watched assets — and inside those limits you get the whole dashboard (holdings, performance, risk, dividends), Explore, the simulations, the scored trade recommendations, the insights bell, a portfolio brief by email, and the assistant with a small budget on our own key, or free on your own key or a local model. It is the whole assistant, not a trial of one: it reads your holdings and the screen you are on, explains any metric with the numbers the card is showing, filters the table from a sentence, looks up any company's quote, news, earnings and latest SEC filing, and changes the dashboard when you ask. No account is needed to start; nothing asks for a card.
Where it falls short: fifty assets is a real ceiling for a diversified portfolio, and the Taxes tab, the full set of alert types, unlimited accounts, the larger assistant budget and the MCP server that connects Claude Code or Codex are all Pro; there is no native mobile app yet; and the free assistant budget is metered in what the calls cost rather than in questions, so a long conversation on an expensive model spends it quickly.
Ghostfolio
Best for: unlimited and free, if you are willing to run Docker.
Self-hosted free — AGPL-3.0 · Cloud from US$48/yr, one-time
Self-hosted Ghostfolio is the most generous free plan on this page by a distance, because it is not a plan: run the container on your own hardware and there is no cap on anything, no telemetry you did not configure, and an anonymous token instead of an email address. Import CSV or JSON or push transactions through the REST API, and use the benchmarks, the X-ray for cluster risk and fees and the FIRE calculator. Side by side with ours on the Fortunest vs Ghostfolio page.
Where it falls short: the cloud free tier is much thinner — a summary, allocations and benchmarks; there are no broker connections at all; and self-hosting means you own the updates, the database and the backups.
getquin
Best for: getting every account connected without paying.
Free 0 €/yr · Premium €89.99/yr · Wealth €149.99/yr
getquin's free tier is unusual in what it does not cap: unlimited bank and broker connections, real-time financial data, a full net-worth overview and what it calls essential portfolio analysis, on web, iOS and Android, with data stated to sit in Germany and Europe under AES-256. For an investor with accounts at five institutions, that alone can be worth more than a richer analysis over a portfolio you had to type in.
Where it falls short: the analysis is the paid part — AI-powered analysis, dividend KPIs and forecasting and advanced performance analytics all start at €89.99 a year; risk metrics and tax are not described at all; and an account is required before you see anything.
Parqet Basis
Best for: a free plan that does not count your positions.
Basis €0 · Plus €11.99/mo · Investor €29.99/mo
Parqet's free Basis plan gives one portfolio and one watchlist, but "∞ Wertpapier-Holdings" — unlimited securities holdings — plus five further asset types (cash, crypto, precious metals, property), two integrations, basic analyses and over forty currencies. File import from more than fifty brokers works on the free tier; automatic syncing with the five German brokers does not.
Where it falls short: the X-Ray, dividend forecasting and the German tax dashboard are all on Plus; support on Basis is the community; the interface and the tax logic are German-first; and where the data is hosted is not stated.
Snowball Analytics
Best for: a free dividend calendar.
Free — 1 portfolio, 10 holdings · Starter US$79.99/yr
Snowball's free plan is shaped around its speciality: one portfolio, ten holdings, one custom holding and one watchlist, with stocks, ETFs and funds, a dividend calendar, "Top 5 dividend stocks, basic filters", advanced cash accounts, broker report import and deliberately limited benchmarking and rebalancing tools. For someone building a dividend portfolio slowly, that is a usable free year; the rest of the product is on the Fortunest vs Snowball Analytics page.
Where it falls short: the ten-holding cap arrives quickly, everything is priced in dollars, the benchmarking and rebalancing are explicitly limited on the free tier, and no AI features are mentioned anywhere.
Two free things that are not really trackers
Yahoo Finance portfolios
Best for: watching a list, with transactions if you type them.
Free with a Yahoo sign-in
Yahoo's My Portfolio is more than a watchlist: its help pages describe tracking buy and sell transactions, cash deposits, withdrawals, income and fees, a Lots view summarising your purchases by day, dividends that "will be automatically imported" once transactions exist, and a portfolio currency chosen when you create the list. Cost basis uses FIFO for the average cost per share.
Where it falls short: no performance methodology is described — no TWR, no IRR, no risk metrics or benchmark comparison; the help pages do not describe broker-file import formats; and downloading historical data is a Yahoo Finance Gold feature, per Yahoo's own help.
Google Sheets with GOOGLEFINANCE
Best for: people who would rather build it than choose it.
Free
The DIY answer, and a decent one: GOOGLEFINANCE "fetches current or historical securities information from Google Finance" — price, volume, market cap, P/E, 52-week highs and lows, beta, plus a long list of mutual-fund attributes and historical open, close, high, low and volume. With a few formulas you have a live-priced position list that nobody can cap, close or reprice.
Where it falls short: Google states the quote is "delayed by up to 20 minutes", that the function "is only available in English and does not support most international exchanges", and that "historical data cannot be downloaded or accessed via the Sheets API or Apps Script". Cost basis, per-day currency conversion, TWR, IRR, risk and tax are all yours to write — and to debug, silently, for years.
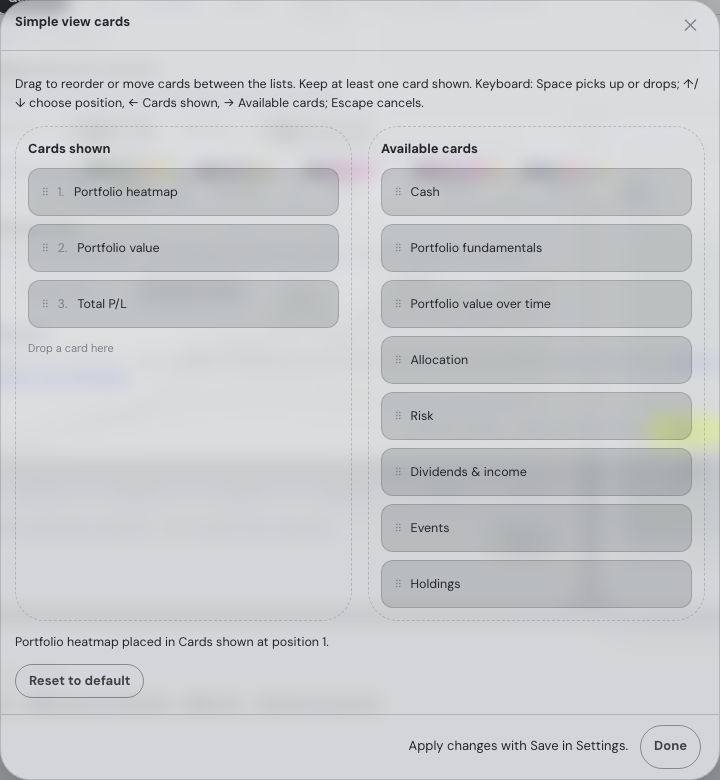
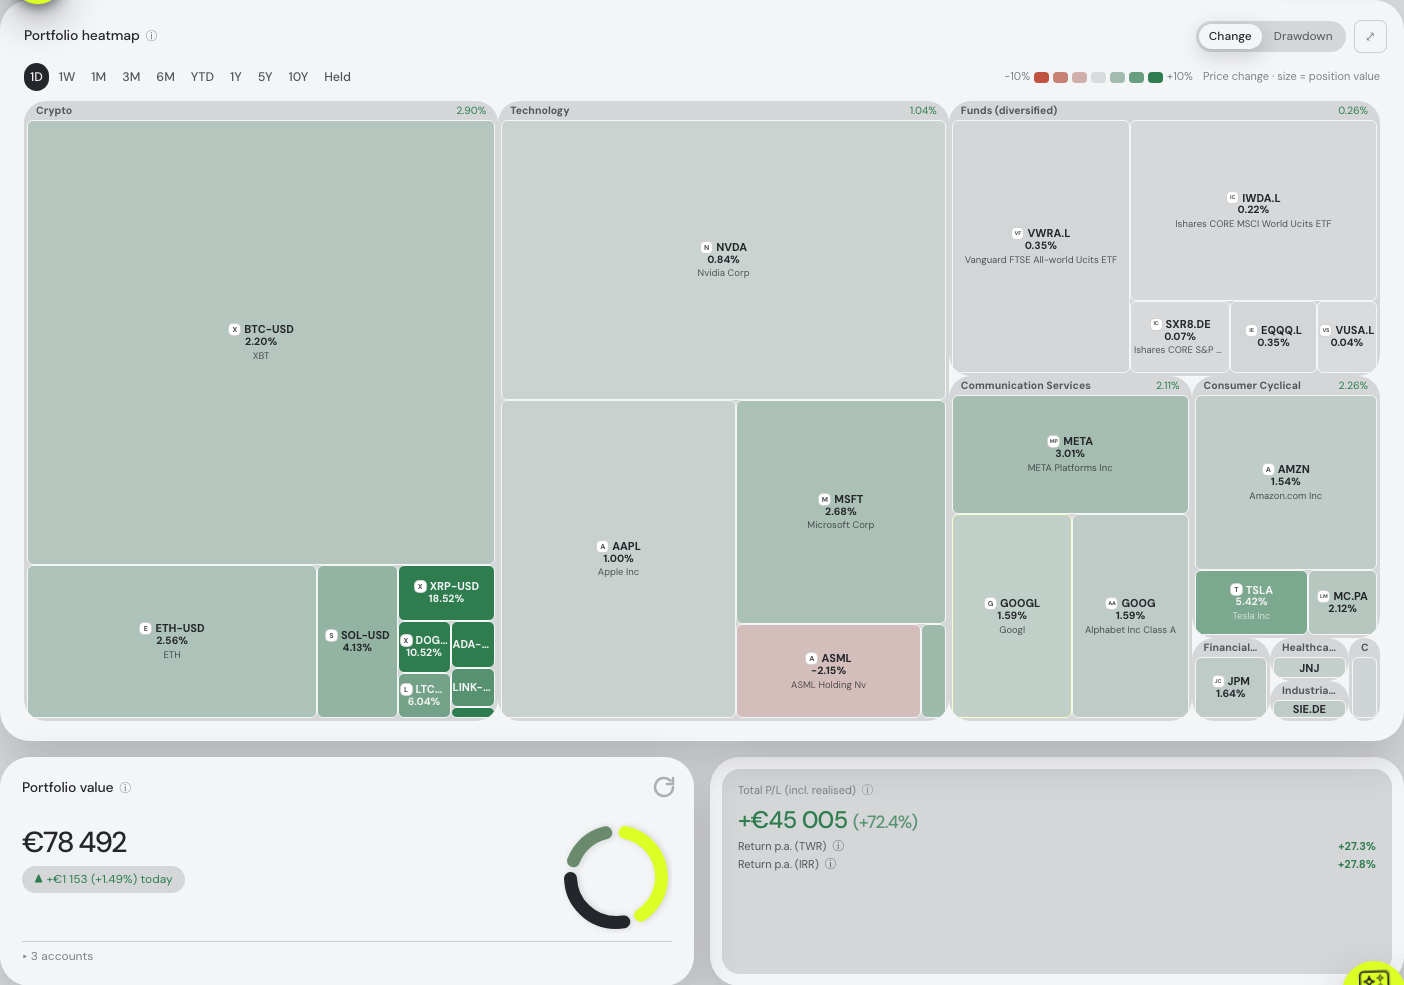
A quieter Free dashboard with Simple view
Synthetic demo, Free guest session, 9 September 2026. This example starts with Try with demo data, then removes Demo IBKR under Settings → Data to show a three-account portfolio. Built-in demo accounts do not consume Free account slots; removing this one is only a choice for the pictured example. It then reduces the Portfolio tab to three chosen cards and changes their order. Simple view changes the layout; it does not remove holdings or alter calculations. The Free limits remain three accounts and fifty assets.
- Open Settings → General → Configure cards.
- Move Holdings from Cards shown to Available cards. Drag Portfolio heatmap before Portfolio value.
- Keep the order Portfolio heatmap → Portfolio value → Total P/L, choose Done, enable Simple view and save.
Compare a watchlist, a sector and an index
Make the practice list first: it is a custom list, not a built-in market index. In Explore → Favourites, use the + at the end of the Lists strip, enter Heatmap practice and press Enter. With that list selected, choose + Add asset and add the US-listed AAPL, MSFT, NVDA and XOM results one by one. The Favourites manual shows the controls. The Free plan allows three lists and twenty starred assets across them.
In the same Free demo, a list named Heatmap practice contains AAPL, MSFT, NVDA and XOM. Open Explore, choose that list in the heatmap, then choose Change → 1W. The capture below shows the list selected in the real interface using a frozen market-data snapshot; its prices and changes are not live quotations.
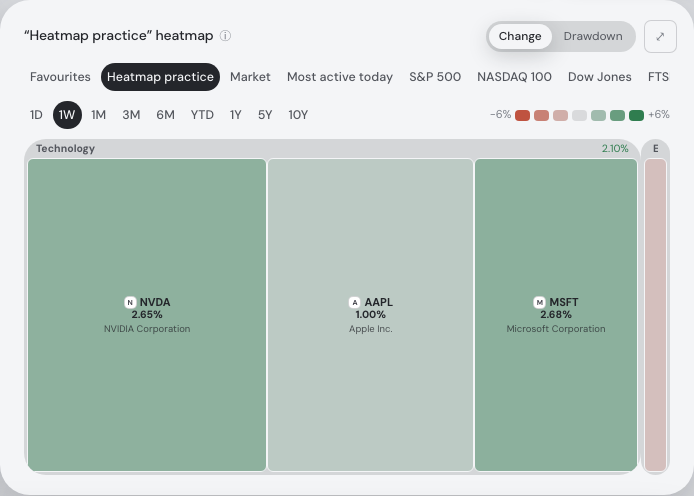
Choose the Technology sector heading to zoom into that sector, then use Show all sectors to return. Choose S&P 500 in the same heatmap selector to compare the index's available constituents.
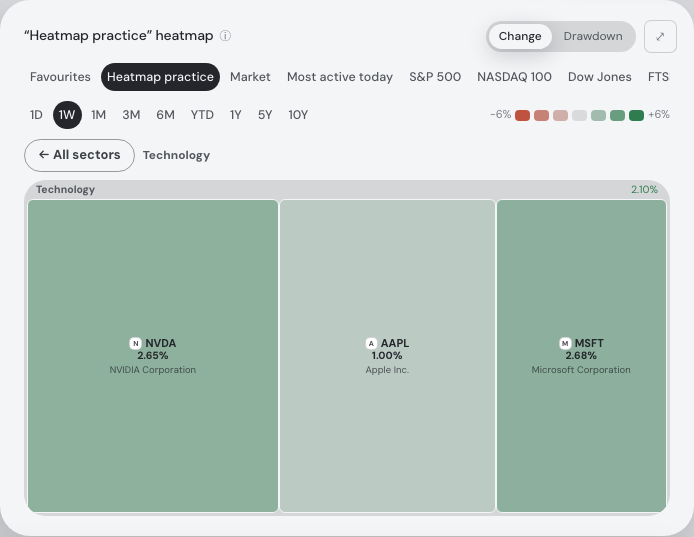
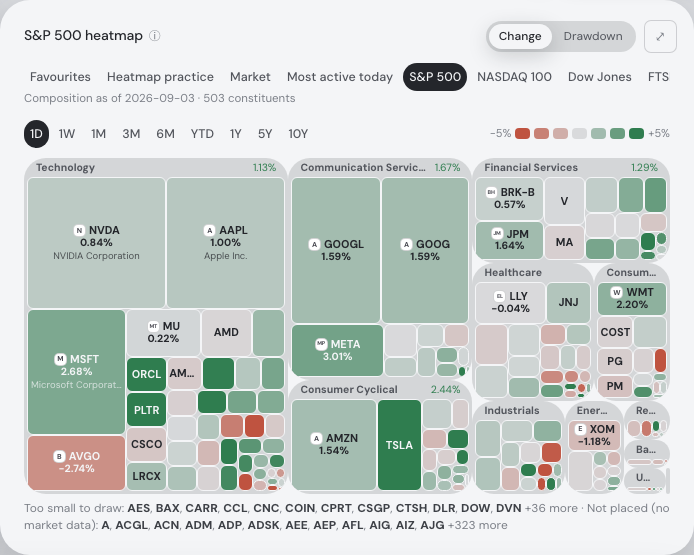
Read the rectangles correctly: market and watchlist cells are sized by market capitalisation; the Portfolio heatmap is sized by each position's portfolio value. Colour shows the asset's price change over the selected window in its listing currency. A large watchlist cell is a large company, not necessarily a large investment of yours. These heatmaps and Simple view are on Free; external-agent MCP and Taxes require Pro.
How we compared
We read each vendor's own pricing page for what the free tier contains and, more importantly, what it does not, then their feature and help pages for anything the pricing page glossed over. Every cell above describes the free tier unless it says otherwise. Where a page is silent the cell says "not described" — that is a statement about the page on 7 September 2026, not about the product. We build Fortunest, so we are not neutral: our free plan is one of eight here, it is beaten outright on generosity by Portfolio Performance and by a self-hosted Ghostfolio, and its fifty-asset ceiling is named in our own verdict rather than left for you to discover.
Questions people ask
What is the best free portfolio tracker in 2026?
If free must mean everything, Portfolio Performance: open source, nothing held back, a file on your own disk. If it must be a modern dashboard with analytics and an assistant, our pick is Fortunest's free plan — the whole dashboard, three accounts, fifty assets, three watchlists and the assistant on a small budget, with no account and no card. Ghostfolio is free without limits if you host it yourself.
Is there a portfolio tracker with no account and no credit card?
Two. Portfolio Performance is a desktop program with a file, so there is nothing to sign up for. Fortunest's free plan works as a guest in the browser: no account, no card, and your data lives in a private session plus a mirror in your browser until you choose to create an account. Ghostfolio comes close with an anonymous token instead of an email address. getquin, Parqet, Sharesight, Snowball and Yahoo Finance all require an account.
How many holdings can you track for free?
The caps differ by an order of magnitude. Sharesight and Snowball stop at ten holdings, and Snowball at one portfolio and one watchlist. Fortunest allows fifty assets across three accounts and three watchlists. Parqet's free Basis plan allows unlimited securities holdings plus five other asset types in one portfolio. Portfolio Performance and a self-hosted Ghostfolio have no cap at all. getquin does not publish a limit but puts its analysis features behind Premium.
Can I track my portfolio for free in Google Sheets?
You can, with GOOGLEFINANCE, and it is genuinely free — but read the limits first. Google states the price is a real-time quote delayed by up to 20 minutes, that GOOGLEFINANCE is only available in English and does not support most international exchanges, and that historical data cannot be downloaded or accessed via the Sheets API or Apps Script. Everything else — cost basis, currency conversion, time-weighted return, dividends — is a formula you write and maintain yourself.
What do free portfolio trackers hold back?
Usually one of four things: the number of holdings (Sharesight, Snowball), the analytics (getquin puts AI analysis and dividend forecasting on Premium, Parqet puts the X-Ray and the tax dashboard on Plus), the automation (broker linking, alerts), or the tax view. Fortunest holds back the Taxes tab, unlimited accounts and assets, the full set of alert types and the larger assistant budget — its Free dashboard has size caps, while Taxes, external-agent MCP and investor-group analytics require Pro.
Sources
- Fortunest — plans and pricing, every supported platform, the free assistant budget and the Taxes chapter.
- Portfolio Performance — product site and manual (19 August 2026).
- Ghostfolio — pricing, features and the source repository (19 August 2026).
- getquin — pricing (7 September 2026); security and performance pages as read on 19 August 2026.
- Parqet — Preise & Pläne (7 September 2026).
- Sharesight — features (7 September 2026); pricing and privacy policy (19 August 2026).
- Snowball Analytics — pricing (7 September 2026).
- Yahoo Finance — the portfolio overview, transactions and historical-data download help pages (7 September 2026). Google Sheets — the GOOGLEFINANCE function reference (7 September 2026).
Signals, analyses and assistant answers in Fortunest are informational — not financial or tax advice.