Guides · Fortunest facts reviewed 8 September 2026
Backtest your trade plan: replaying a year of portfolio recommendations on your own transactions (2026)
Most backtesters answer “how would this model portfolio have done?”. Fortunest's historical replay answers a narrower and more useful question: would following your own trade plan, month by month, have beaten what you actually did — and beaten leaving the deposits in cash? It is free, it runs on your real transaction history, and it states its assumptions. Portfolio Visualizer remains the better tool for testing an allocation you have not built yet.
The short answer
- Our pick for backtesting your own plan: Fortunest — replays last year's trade recommendations at a monthly interval (or any interval you set) from your dated transactions, using only the information available at each historical close, and compares actual against recommended against passive with the same external flows. Free on every plan; the coverage of the run is printed rather than assumed.
- Best for testing an allocation you do not yet hold: Portfolio Visualizer — backtesting, Monte Carlo, factor regression and optimisation over portfolios described as tickers and weights. Free tier: up to 15 assets, limited history, no month-to-date. Basic $30 a month, Pro $55, both billed annually.
- Best for dividend portfolios: Snowball Analytics — “Build and test dividend portfolios”, ten years of history on Free and Starter, “30+ years backtests” on Investor and Expert (US$149.99 and US$249.99 a year).
- No backtest, but honest about it: Ghostfolio and Portfolio Performance — Ghostfolio's README lists transactions, returns, charts and a static risk analysis; Portfolio Performance rebalances to a target allocation and benchmarks against an index. Neither describes a historical strategy replay.
- Not described: getquin — its pricing page lists analysis, dividend forecasting and AI, with no backtesting on any plan.
What the replay actually does
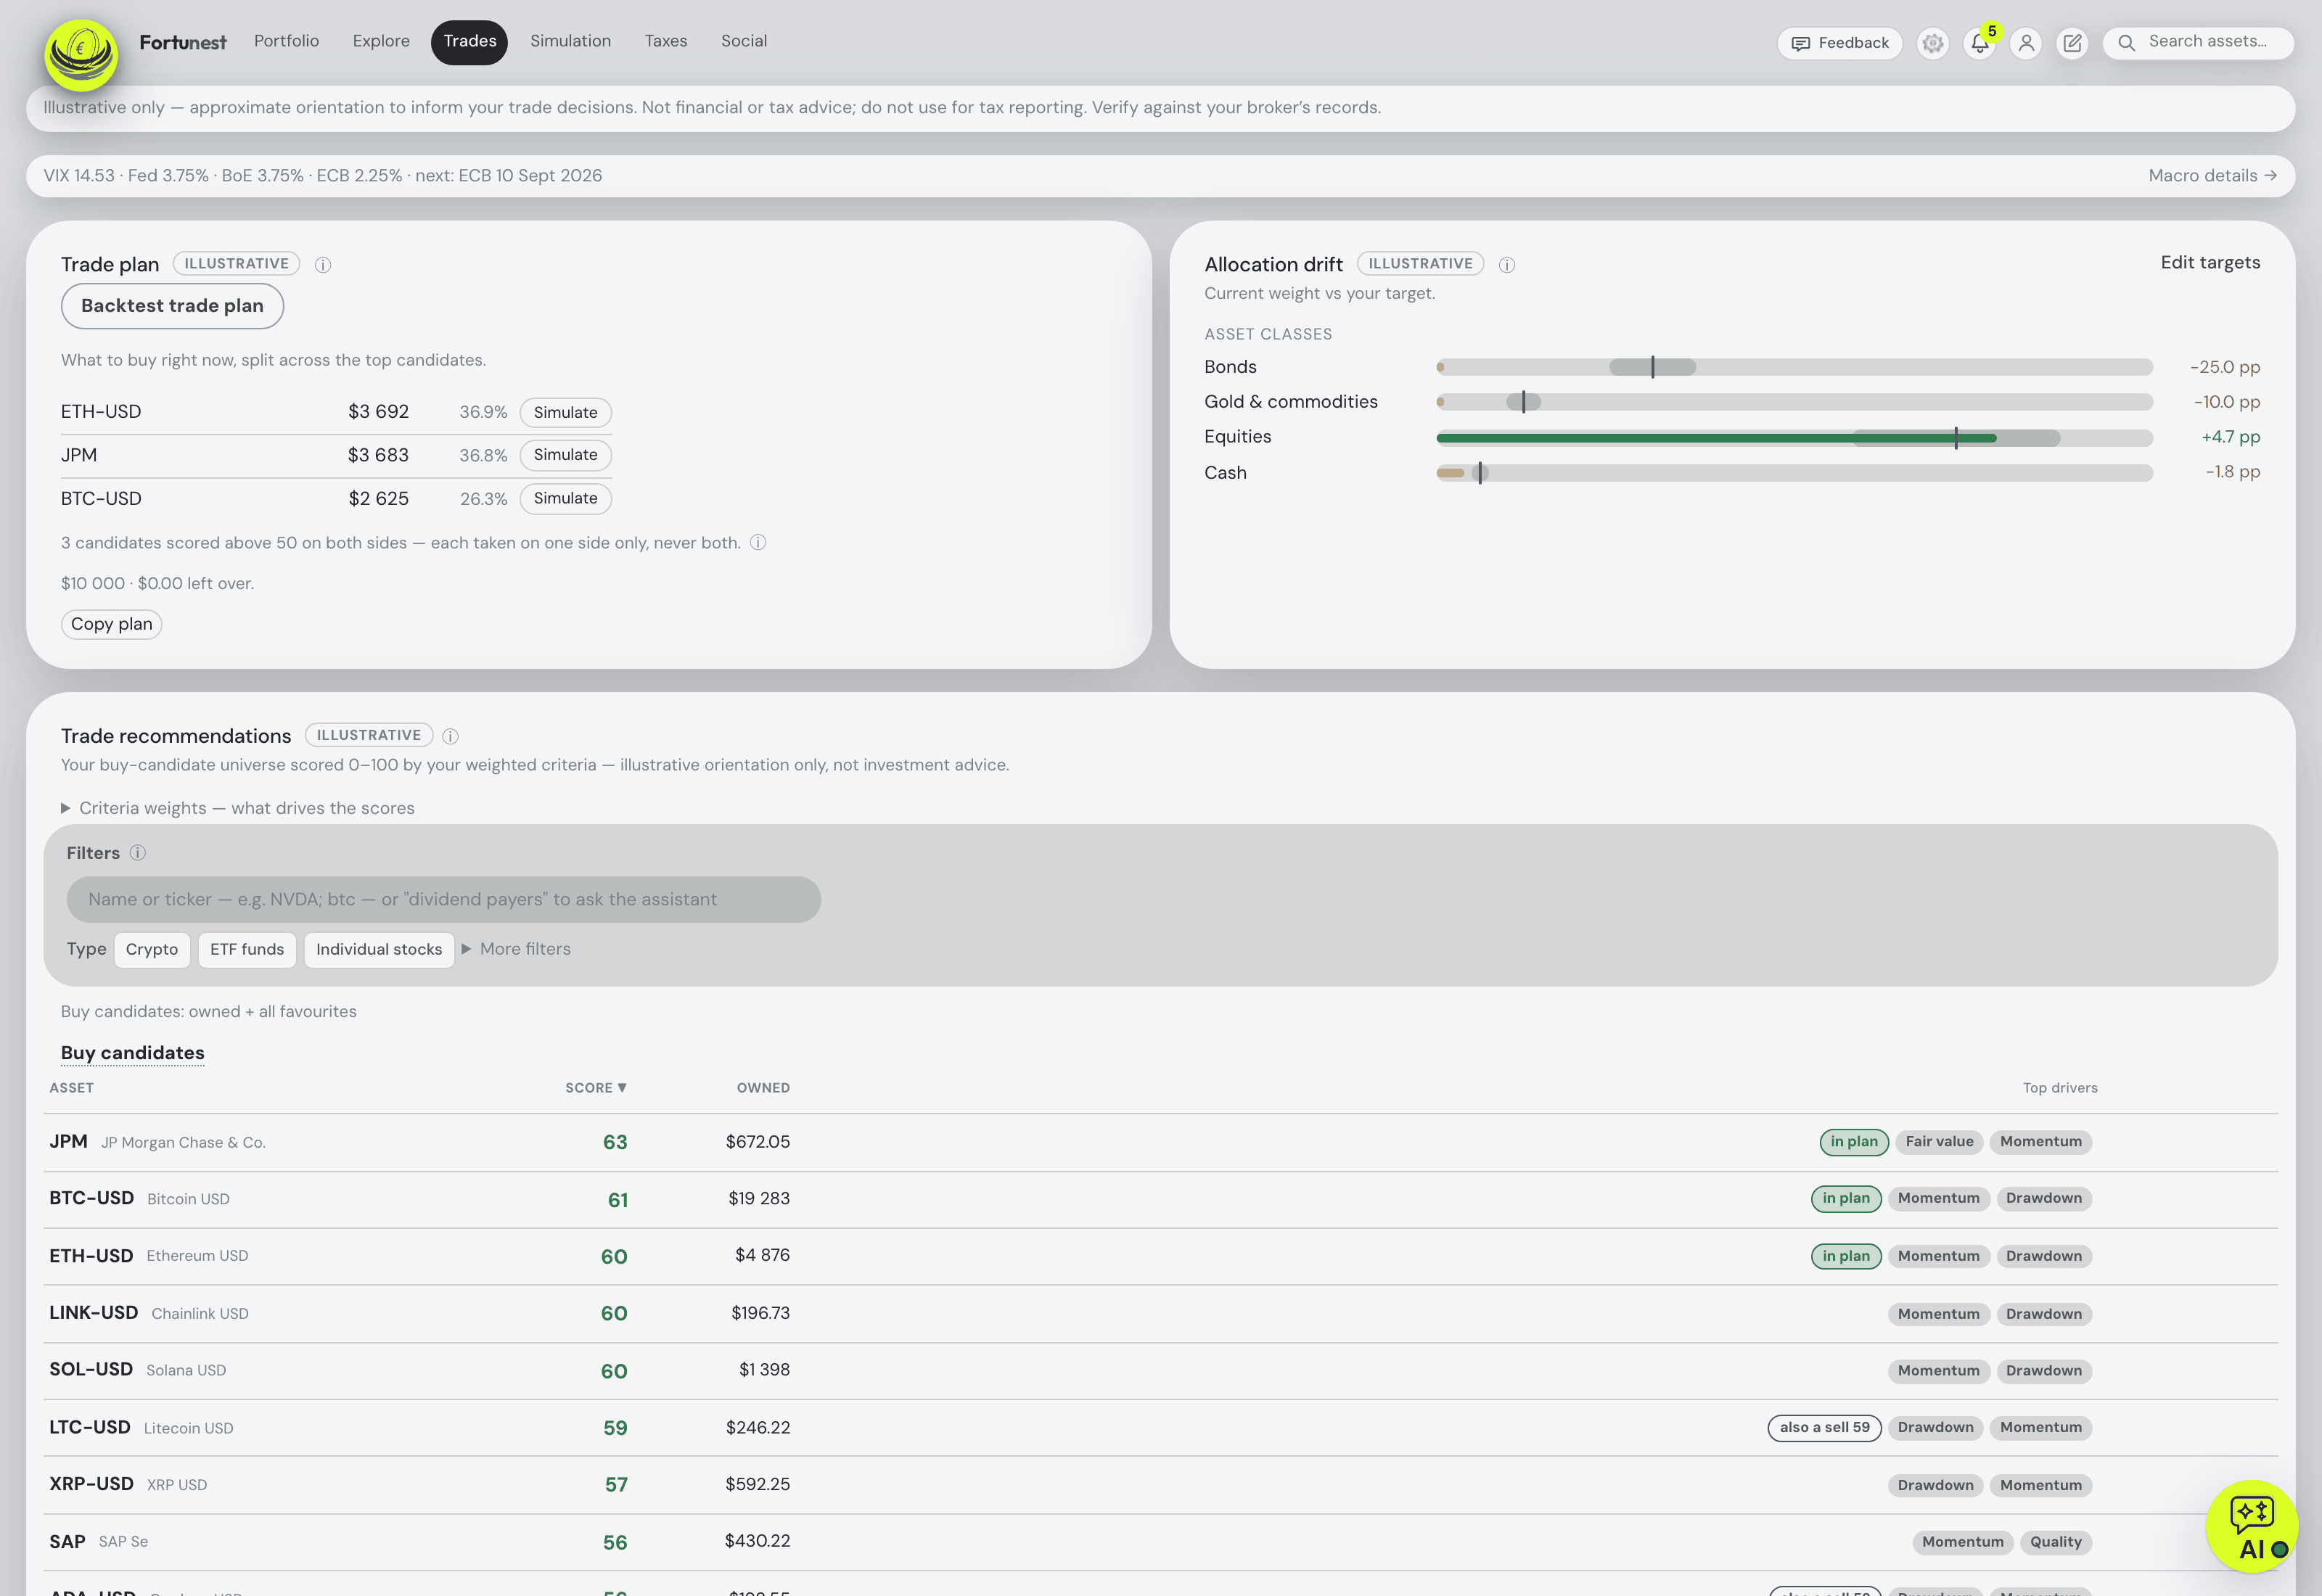
Press Backtest trade plan on the Trades tab and the Simulation tab opens with Historical · recommended trades selected and runs by itself. The replay starts from the portfolio reconstructed out of your dated account transactions a year ago — or the earliest transaction you have, if that is more recent — and ends yesterday. Your current planner settings, targets, tax rules and trade budgets are fixed retrospective parameters, and the candidate universe is what you held at the start plus favourites that were already saved by their recorded addition dates.
At each interval — calendar months by default, or any number of months or days — the engine scores candidates and issues orders exactly as the live Trades tab would. The crucial constraint is that each decision uses only prices and reports available by that historical close: SEC financial facts become usable the day after filing, in the versions available then, and current analyst targets, forward estimates, sector classifications, fund look-through and valuation anchors are excluded outright. Criteria that cannot be evaluated leave the scoring denominator instead of counting as zero. Orders execute at the next observed daily close within seven days.
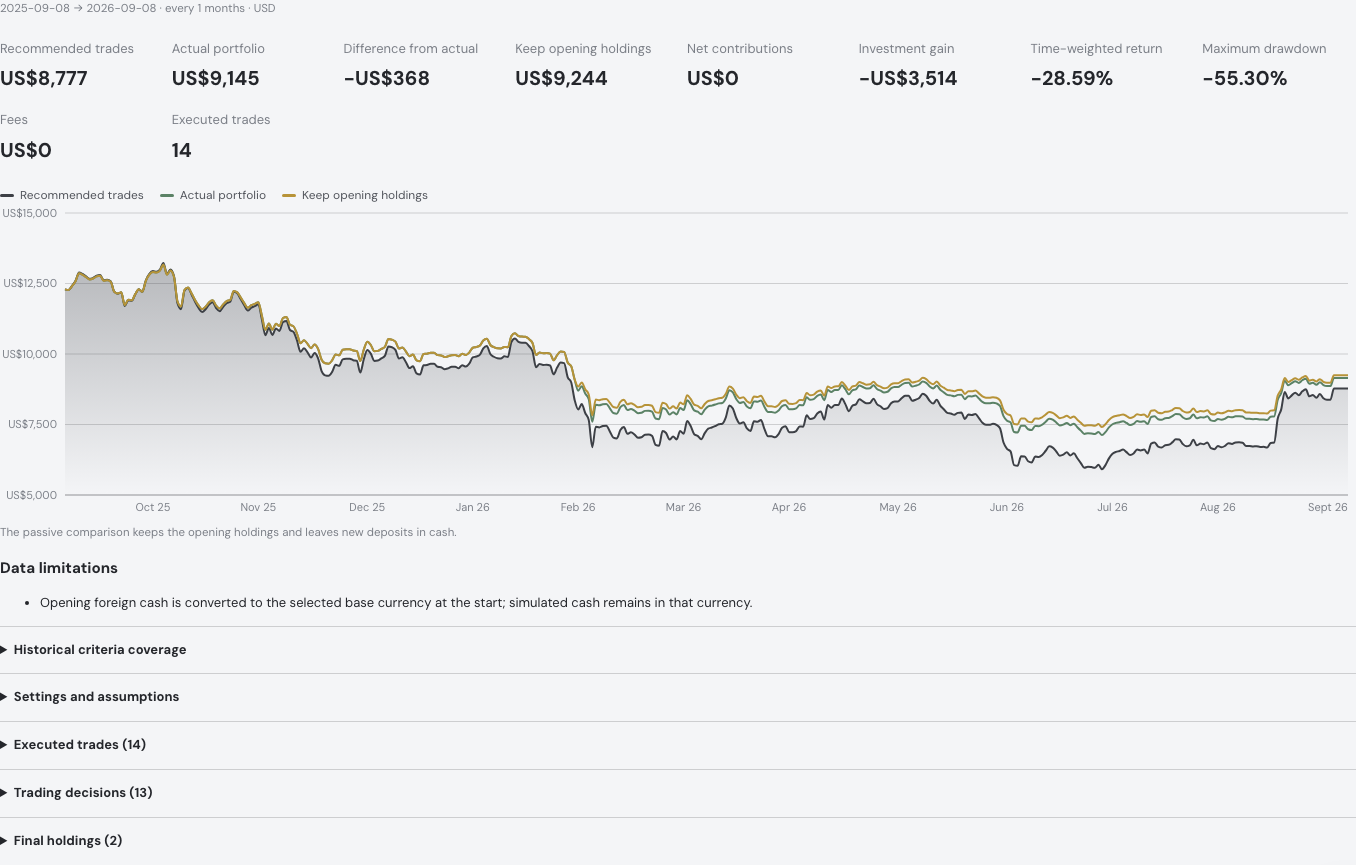
The chart then draws three lines: your actual account history, the simulated recommendations, and holding the opening portfolio with new deposits left in cash. Both simulations receive the same external flows you really made — the passive line is not a different investor with different money. Expanding the results shows signal and execution dates, order reasons, final holdings and the assumptions. You can change the interval, adjust local criterion weights, restore your saved weights or restore the company-rating defaults, and none of it touches your saved settings or places a real trade. The assistant can launch it from a sentence: backtest the recommended trades over the last year.
Try the replay with a small sample account
Start with the synthetic Kraken ledger CSV: a $10,000 opening deposit, purchases of 0.04 BTC and 1 ETH in August 2025, and a further 0.2 ETH purchase in February 2026. There are no later deposits, withdrawals, rewards or fees in this sample.
- Open Fortunest in an empty session. In Settings → Data, upload the sample CSV and press Save. Set the base currency to USD.
- In Settings → Trades, set Invest to 500, Number of buys to 2, Min order to 50 and Sell to 0.
- Choose Portfolio targets. Add crypto targets BTC-USD 50% and ETH-USD 50%; leave Cash at 0%, Individual stocks empty. Save. Crypto uses targets, not company ratings; see planner rules.
- Open Trades → Backtest trade plan. This opens Simulation → Historical and starts the default monthly replay. Leave External in-kind transfers on Strict reconstruction.
- Wait for the results, then compare Recommended trades, Actual portfolio and Keep opening holdings. Expand Executed trades to check each signal date and its later execution date.
- Try a different interval and press Run backtest. This places no broker orders.
A captured run, with the inputs behind it
Recalculated on 14 September 2026 with the simplified planner and 50/50 crypto targets. This captured result uses the 14 September planner version. The original dates and frozen BTC/ETH observations through 4 September 2026 are unchanged. Spot distributions are zero; staking rewards are excluded. Download the price inputs and settings and checksums.
The price CSV is an audit record, not a broker import. The hosted app obtains its own market history and ends a new replay at yesterday, so a later run can have different dates and results. The capture’s frozen inputs make its figures inspectable; the steps above reproduce the workflow. Historical replay uses recorded external flows and does not invent deposits from Invest.
| 8 September 2025 → 8 September 2026 | Calculated value (USD) |
|---|---|
| Opening portfolio, including cash | $12,290.93 |
| Recommended trades: final value | $8,777.33 |
| Actual portfolio: final value | $9,145.08 |
| Keep opening holdings: final value | $9,243.67 |
| Recommended minus actual | −$367.75 |
| Executed trades / net contributions | 14 / $0.00 |
The target-based replay finished $367.75 below the recorded account. Both trailed keeping the opening holdings. The first signal, on 8 September 2025, bought $262.48 ETH and $237.51 BTC at the next observed closes on 9 September, in proportion to their target gaps. See the full result and trade record.
You can also explore the built-in Try with demo data account for a broader portfolio. In either case the passive comparison keeps opening holdings and leaves new deposits in cash; it is not an S&P 500 benchmark. The replay assumes zero fees and slippage and no tax payments.
The assumptions, said out loud
A backtest is only as honest as the list of things it pretends. Fortunest's are printed with the run: fractional shares, zero fees and slippage, and no tax payments. Buys use available cash; sales do not enlarge the requested buy amount. There is no leverage. Splits change quantities and unit costs, dividends enter cash on their ex-date, and the coverage table reports trailing paid dividends rather than today's indicated yield. Unknown lot costs use FIFO for disposal; tax estimates remain unavailable. Accounts without a cash ledger have their recorded trade funding read as deposits or withdrawals.
Two of those matter more than they look. Zero fees flatters any strategy that trades often, so a plan that wins by a hair in the replay may lose in your account — the trade plan's own minimum-order rule exists partly for that reason. And no tax payments means a taxable sale has no cash tax deduction in the replay while the Taxes tab would have something to say about it. Neither is a flaw in the run; both are reasons to read the gap between the lines rather than the last number on them.
Strict reconstruction, or the cash-equivalent approximation
Transfers of assets in or out of your accounts are the hardest part of any replay, and there are only two honest options. Strict reconstruction is the default: the run uses your actual records, and if the acquisition records are missing it stops rather than inventing them. If you would rather have an answer than nothing, you can explicitly choose Cash equivalent (approximation), which turns each recorded transfer during the replay into an equal cash deposit or withdrawal for the recommended and passive simulations, priced at a historical quote on or before the transfer and at most seven days old, with FX from on or before that quote date.
The approximation is labelled in the results, and each transfer is listed with its account, quantity, quote date, price and cash amount — and stated plainly not to be an original acquisition cost. Incoming assets join the candidate universe from their recorded arrival date; your actual portfolio line is unchanged, and the passive simulation leaves incoming cash uninvested. The assistant will only use this mode if you ask for it, and says that original acquisition dates and tax costs are unknown when it does.
A reconstruction with coverage, not an archive
This is the sentence to take away, because it is the one most backtesting marketing avoids: the run is a reconstruction with explicit coverage, not an archive of exact past app output or vintage provider data. Nothing about last year's recommendations was stored at the time, so the replay recomputes them from what was knowable then — and where a historical input is missing, no current metric is allowed to fill the gap. The coverage table names every exclusion and every partial reconstruction, which is the only reason the result deserves any trust.
The same discipline stops runs that cannot be made honest. Inferred balances from a later account snapshot, missing historical prices or exchange rates, and unknown distributions during exposure each end the run with an explanation instead of a plausible-looking line. A manual asset valued at an assumed APY is caught before the run starts, named, and pointed at the fix. Runs live in memory: they can be cancelled, and reloading the app does not preserve one.
The comparison
Each cell is what the vendor's own pages say, in the vendor's terms, on the date in the footnote. Not described means the page does not mention it. A green ✓ marks whichever product leads a row on its own terms.
| Fortunest1 | Portfolio Visualizer2 | Snowball3 | Portfolio Performance4 | Ghostfolio5 | getquin6 | |
|---|---|---|---|---|---|---|
| What is backtested |
|
|
|
|
|
|
| Your real transactions, or a model |
|
|
|
|
|
|
| What it compares against |
|
|
|
|
|
|
| History available |
|
|
|
|
|
|
| Point-in-time discipline |
|
|
|
|
|
|
| Assumptions stated |
|
|
|
|
|
|
| Where it runs |
|
|
|
|
|
|
| Free plan |
|
|
|
|
|
|
| Paid from |
|
|
|
|
|
|
Cells were checked against the sources below on 7 September 2026, except Portfolio Performance's and Ghostfolio's feature lists, checked on 19 August 2026 for our landing-page comparison and re-read in Ghostfolio's repository on 7 September. Prices are each vendor's list price before promotions and, for Fortunest, before VAT. "Not described" is a statement about those pages on that date, not about the product.
The verdicts
Fortunest — our pick
Best for: finding out whether following your own rules would have beaten what you actually did.
Free on every plan · Pro €6.99/mo or €69/yr for the rest of the app
The replay is the only one here that starts from your own transaction history and asks a decision question rather than an allocation question. Three lines — what you did, what the plan would have done, and doing nothing with the same deposits — settle an argument that is otherwise unwinnable. The point-in-time discipline is real: SEC facts only from the day after filing, no current analyst targets, orders filled at the next available close. And the coverage table means you can see what the run did not know, which is the only defensible way to read a backtest.
Where it falls short: one year back by default and no further than your earliest transaction, so it cannot test a decade of an allocation; zero fees and no taxes flatter frequent trading; nothing is archived, so it is a reconstruction rather than a record; and a run lives in memory, so reloading the app loses it.
Portfolio Visualizer
Best for: testing an allocation you are considering, not one you already own.
Free · Basic $30/mo · Pro $55/mo, billed annually
The reference tool for this category, and deservedly. Backtesting sits beside Monte Carlo simulation, factor regression, efficient-frontier and Black-Litterman optimisation, tactical allocation models and asset correlation. Portfolios are described as tickers and weights — the site's own examples are the Ivy Portfolio and the No Brainer — which makes it the right instrument for “would 60/40 have held up?” and the wrong one for “was my trading any good?”. Its own disclaimer is blunt: all outputs are hypothetical.
Where it falls short: importing your own broker history into a backtest is not described; the free tier stops at 15 assets with limited history and no month-to-date; and paid access is expensive next to everything else in this table at $360 or $660 a year.
Snowball Analytics
Best for: dividend investors testing an income portfolio over decades.
Free · Starter US$79.99/yr · Investor US$149.99/yr · Expert US$249.99/yr
Snowball's backtesting is built around its speciality. Every plan can “Build and test dividend portfolios”; Free and Starter test over ten years of history, Investor and Expert over “30+ years backtests” — long enough to include more than one regime. With the dividend calendar, payout tracking and custom withholding tax beside it, it answers the income investor's question end to end.
Where it falls short: the free plan is one portfolio of ten holdings, so the backtest arrives before the room to use it; the assumptions behind it — fees, taxes, reinvestment — are not described on the pricing page; and it tests a portfolio you build rather than the trades you made.
Portfolio Performance
Best for: a free, local record of what really happened, rather than a simulation of what might have.
Free — EPL 1.0
The strongest free tool here for the half of the job that comes before backtesting: a complete transaction history in a file on your own disk, benchmarking against an index, volatility, semivariance and maximum drawdown, and rebalancing to a target allocation. Foreign-currency accounts are converted at ECB rates.
Where it falls short: no historical strategy replay is described, so there is no way to ask what a rule would have done; there is no projection and no tax report beyond tax and fees per transaction; and you do the importing and the maintenance yourself.
Ghostfolio
Best for: self-hosting your holdings and returns, with a REST API to build on.
Self-hosted free — AGPL-3.0 · Cloud from US$48/yr, one-time
Ghostfolio's README is a short, honest feature list: transactions, multi-account management, return on average investment for today, WTD, MTD, YTD, 1Y, 5Y and Max, charts, a static analysis to identify potential risks, import and export, and a mobile-first progressive web app. It runs in Docker on your own hardware, tracks stocks, ETFs and cryptocurrencies, and exposes a REST API — so a determined owner can compute a backtest outside it.
Where it falls short: no backtesting or historical replay is mentioned anywhere in its documentation; there are no broker connections at all, so every trade arrives by file or API; and the cloud free tier is a summary rather than the whole product.
getquin
Best for: connection breadth and analysis, if a backtest is not what you are after.
Free · Premium €89.99/yr · Wealth €149.99/yr
getquin's free plan carries unlimited bank and broker connections, real-time data, a net-worth overview and essential analysis; Premium adds AI-powered analysis, dividend KPIs and advanced performance analytics; Wealth adds planning, goals and a retirement plan. For “where do I stand and what does it look like”, it is a short path with very little setup.
Where it falls short: backtesting is not listed on any plan, and neither is a historical replay of a strategy — so a strategy question has to be taken somewhere else. Risk metrics and tax handling are also not described on its pricing page.
How we compared
We picked the tools people reach for when they want to test a portfolio rule, and read each vendor's own feature, pricing and documentation pages rather than reviews. Where a page says nothing about a row, the cell says so — and a tool with no backtest is not thereby a bad tool. We build Fortunest, so we are not neutral; our own limits, including the ones that make a backtest flattering, are in our verdict.
Questions people ask
Can I backtest a rebalancing strategy on my own real transactions?
In Fortunest, yes: the replay reconstructs your portfolio from dated account transactions a year ago — or the earliest transaction you have, if that is newer — and runs to yesterday, using your real deposits and withdrawals for every scenario. Portfolio Visualizer backtests a model portfolio you describe as tickers and weights, which is a different and equally valid question. Snowball tests a dividend portfolio you build. Neither describes importing your own broker history into a backtest.
Is there a free way to backtest a portfolio strategy?
Three. Fortunest's Trades tab and its historical replay are free on every plan. Portfolio Visualizer's free tier runs backtests on portfolios of up to 15 assets, with limited history and no month-to-date results. Snowball's free and Starter plans test a portfolio over ten years of history, with 30+ years on Investor and Expert. Portfolio Performance is free and open source but describes no backtest, and Ghostfolio's README lists none.
What does the backtest assume about fees and taxes?
Fortunest states its assumptions rather than burying them: fractional shares, zero fees and slippage, and no tax payments. Orders execute at the next observed daily close within seven days, buy budgets are capped by available cash, with no leverage, splits change quantities and unit costs, and dividends enter cash on ex-date. Unknown lot costs use FIFO for disposal; tax estimates remain unavailable. A real broker charges you and a real tax year taxes you, so treat the result as a comparison, not a forecast.
Does it replay the recommendations the app actually gave me last year?
No — and it says so. Nothing was archived, so the run is a reconstruction with explicit coverage rather than a record of past output. Each decision uses only prices and reports available by that historical close, with SEC facts usable the day after filing; current analyst targets, forward estimates, sector classifications, fund look-through and valuation anchors are excluded, and no current number is allowed to fill a historical gap. The coverage table lists every exclusion and partial reconstruction.
Why did my backtest refuse to run?
The run stops rather than guessing. Inferred balances from a later account snapshot, missing historical prices or exchange rates, and unknown distributions during exposure each end a run with an explanation. A manual asset valued at an APY is checked before the run starts and named, with the fix — exclude it under Settings, Data, Other assets, then retry. Unresolved instrument identifiers need a market-data mapping; they are never priced at zero or at today's price.
Sources
- Fortunest — Backtest recommended trades, the trade plan, the Taxes chapter and plans and pricing.
- Portfolio Visualizer — tools overview and pricing (7 September 2026).
- Snowball Analytics — pricing (7 September 2026).
- Portfolio Performance — product site (7 September 2026) and its manual (19 August 2026).
- Ghostfolio — the source repository and README (7 September 2026) and its pricing page (19 August 2026).
- getquin — pricing (7 September 2026).
Signals, analyses and assistant answers in Fortunest are informational — not financial or tax advice. A backtest is a scenario to reason about, never a forecast.