Guides · Fortunest facts reviewed 8 September 2026
Track Warren Buffett and other super-investor 13F portfolios — and compare them with your own (2026)
Every quarterly 13F filing is public and free, so the question is not who shows you Berkshire Hathaway's holdings — all five products here do — but whether you can put them next to your own weights and see the gap. Fortunest is our pick because it does exactly that; Dataroma is the best free way to read the filings themselves, and WhaleWisdom the deepest toolbox for testing them.
The short answer
- Our pick for comparing filings with your own portfolio: Fortunest — 25 well-known filers, quarterly portfolios rebuilt from EDGAR, filing cards in the feed, and a group portfolio that puts the room's consensus beside your own weights across six allocation dimensions. Free follows two investors; the roster and the group are Pro, €6.99 a month or €69 a year.
- Widest free roster: Dataroma — “Currently tracking portfolios of 83 Superinvestors”, plus a Grand Portfolio aggregating 1,864 stocks worth $1.148 trillion with an ownership count per name. No pricing is described on its pages.
- Deepest 13F toolbox: WhaleWisdom — a backtester, combined holdings, a 13F stock screener, a heat map, a fund performance evaluator, an Excel add-in and a developer API. Free for the past two years of data; Standard $90 a quarter, Pro $150.
- Most filers of all: GuruFocus — Premium covers 144 hand-picked gurus; Premium Plus tracks “all the institutional investors that file 13F and 13D/13G forms”, over 4,000 of them and 18,000+ portfolios, with email alerts. Prices were not readable on the pricing page we fetched.
- Cheapest alerts: Stockcircle — 50+ gurus from SEC data with instant trade notifications on Pro, $8.25 a month billed annually or $16.49 monthly; without Pro, one monthly recap email.
What a 13F is, and what it is not
A fund managing $100M or more in US-listed stocks must report its holdings to the SEC every quarter, within 45 days of quarter end. That public record is the entire raw material of this category. It also sets four hard limits that no product can engineer away, and any tracker that hides them is selling you a feeling rather than data.
It is late. A quarter-end snapshot published up to 45 days afterwards means a position opened last month is not in it, and a position bought and sold inside the quarter never appears at all. It is partial: US long positions only — no cash, no shorts, no bonds, no non-US listings, so a manager's European or Indian book is simply absent from the filing. It over-reports options, which 13Fs disclose at notional share counts large enough to distort a weight table; Fortunest excludes them from the holdings and states each member's option share separately. And it says nothing about intent: a market maker's filing is an inventory, not a conviction list, which is why two of the roster's blurbs say so in plain words.
The performance figure needs the same warning. A super investor's curve in any of these products is a reconstruction — quarter-end filing weights held between filings, priced on total-return history. Fortunest draws no curve at all when less than 70% of the filed value can be priced, and keeps Super Investors out of the social leaderboards entirely, because a synthetic curve should not race a real track record. Read the provenance banner at the top of a sheet before the numbers under it.
Following a filer, and what arrives afterwards
Fortunest's roster is 25 well-known filers, rebuilt from their public SEC 13F filings — Warren Buffett's Berkshire Hathaway among them, alongside names such as Pershing Square, Bridgewater, ARK, Oaktree, Fundsmith and Baillie Gifford. Following is one-way and takes no approval: press Follow and the fund is on your list. The row shows an approximate yearly return and opens a portfolio sheet with holdings by filed weight, a sector breakdown and a Quarterly changes card — New, Added, Trimmed, Sold out, with the weight and share-count moves.
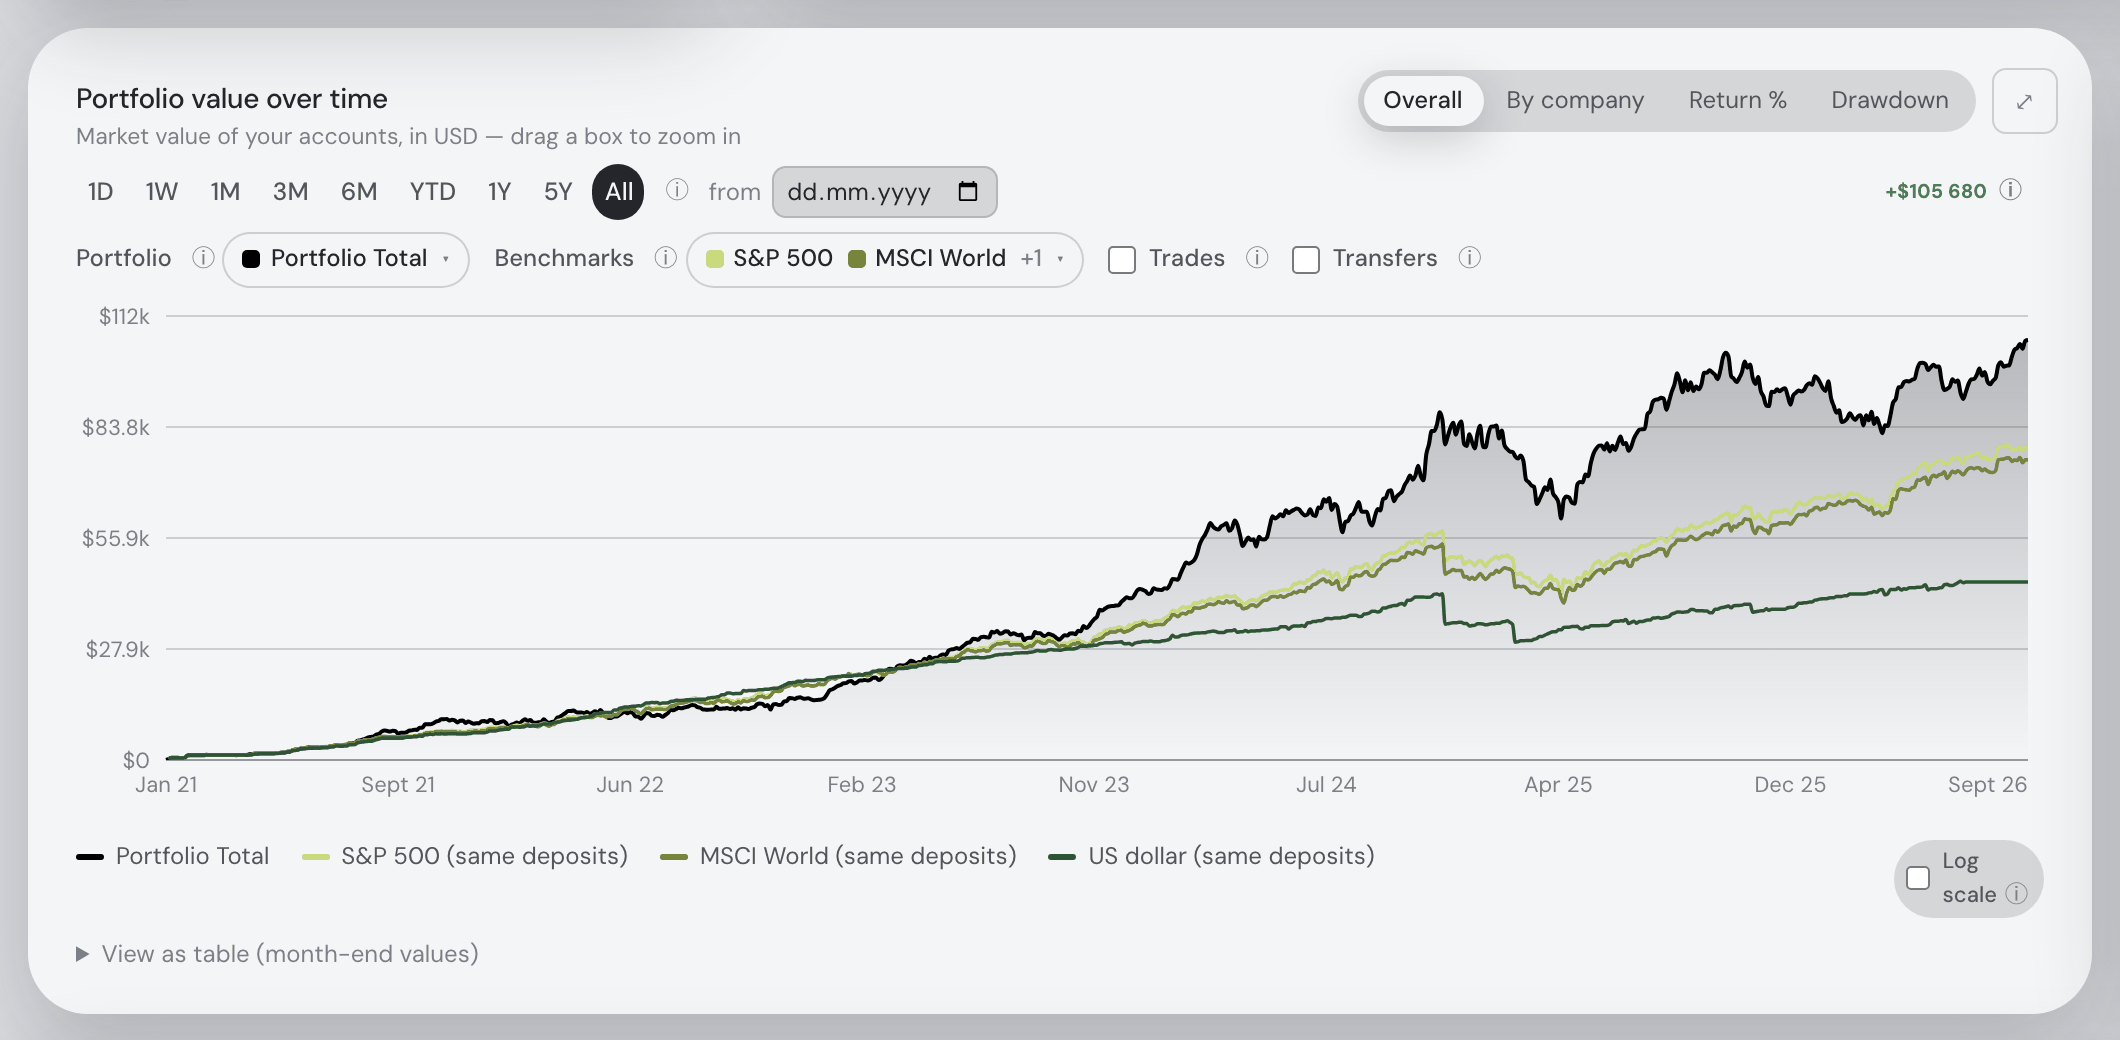
Then the filings come to you. When an investor you follow files a new 13F, the Social feed's first page carries a card of its own: their portrait, which quarter was filed, and the top ten portfolio changes with the verb colour-coded, each asset as a live ticker chip, the weight before and after with the share-count change, and the filed dollar change. It sorts into the feed by filing day and stays there as history, and you can react and reply to it as to any post. Followed investors also become chart benchmarks: in the value chart's Return % and Drawdown views the benchmark picker grows a Super Investors group, drawing each followed investor's reconstructed curve against your own and labelling it “(13F)” so the legend carries the caveat itself.
Where it stops being reading and starts being comparison
Investor groups are Pro; friend groups are Free with an account. To compare a group of friends instead, open Social → Friends → Group portfolio. It uses the relative snapshots your accepted friends chose to share, with equal member weighting. Investor groups use delayed filings and can also weight by filed equity AUM. Neither is joint brokerage management or live copy trading. See group coverage and freshness.
The part that changes how you use filings is the group portfolio. Select Group portfolio in the top row of the Super Investors card and an overlay opens over the feed with the whole room treated as one book. The consensus table gives held-by breadth, the average weight among holders, the group weight, your weight, the gap in percentage points, and conviction — breadth multiplied by average holder weight. Three filters do most of the work: crowded names that you and at least half the room hold, blind spots the room holds and you do not, and lonely names only you hold.
Beside it, six allocation dimensions — regions, sectors, caps, types, currencies and classes — put the group's shape against yours, with top-10 share, effective invested names, member overlap and member turnover. Investor groups use the latest common quarter among followed funds, keep up to 12 common quarters of weight history, and can be weighted equally or by filed equity AUM. Approximate flows estimate share-count changes at quarter-end prices, not actual execution proceeds, and missing funds and comparison periods are counted explicitly rather than quietly dropped. Positions below 0.5% of a fund's full filed equity value are omitted, with the omitted count and weight shown — so an absence there can mean a small holding rather than no ownership.
Three Pro extras carry the consensus into the rest of the app: a Held by followed funds column in Explore's column picker, a Group consensus criterion in the Trades scoring weights — the percentage of your followed funds holding a candidate, independent of fund AUM, explained as “held by 6 of 9 followed funds” — and an opt-in Consensus shift alert that reports a crossing of 50% breadth or a net sale. Your own comparison weights are built on your device and never uploaded, and the assistant can read the same thing in words: “what do my followed funds hold?”. The full behaviour is in the Group portfolios section.
Work through one group comparison
This example starts with a synthetic two-holding IBKR CSV. It is a made-up reader portfolio, not either manager’s account. The group side uses a frozen public SEC filing record for Berkshire Hathaway and Pershing Square, copied from the app’s filing cache on 9 September 2026. The current comparison uses their common 2026 Q2 quarter, with filings dated 14 August 2026. The capture settings and file checksums identify the exact records used.
- In an empty signed-in Pro account, import the sample under Settings → Data and Save. Set the base currency to USD.
- Open Social → Super Investors and follow Warren Buffett and Bill Ackman. Open Group portfolio in that card’s heading.
- Wait until both Group and Your comparison say ready. Check the count of readable members and the omitted small-position weight before interpreting the table.
- Choose Equal per member. Find AAPL and compare Group, You and Gap. Switch weighting to By filed equity AUM and observe how the group weight changes while the sample’s own weight stays fixed.
- Use Blind spots to inspect qualifying positions held by the group but absent from the sample. The allocation tabs offer a second comparison by sector, region, size and other dimensions; read the classification coverage alongside them.
| AAPL in the captured run | Equal per member | Filed equity AUM |
|---|---|---|
| Held by | 1 of 2 funds | 1 of 2 funds |
| Group weight | 11.0% | 20.7% |
| Synthetic reader weight | 49.2% | 49.2% |
| Gap: reader minus group | +38.2 percentage points | +28.5 percentage points |
Berkshire reports much more equity value than Pershing in these filings. Giving each fund one equal vote makes Apple 11.0% of the group; weighting those same filed holdings by equity value makes it 20.7%. The capture has 2 of 2 readable members and omits 14 positions below the per-fund cutoff, totaling 1.2% of equal group weight. Remaining weights are not rescaled.
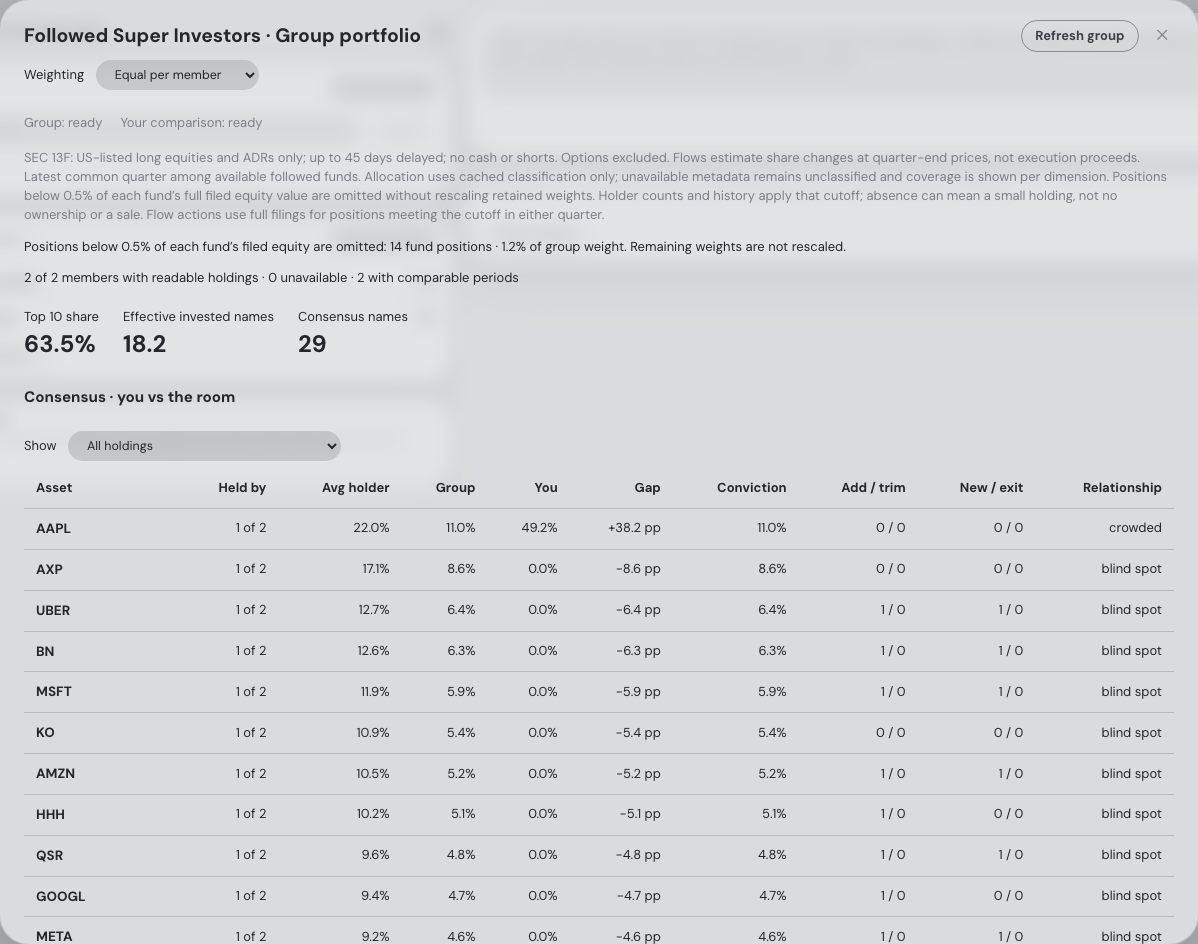
The calculated tables and reader-price record include the sample’s observed Apple and Alphabet closes from 3 September 2026, so its own weights can be checked separately from the filings.
The downloaded filing record documents the captured inputs; it is not an upload format for Social. A later run uses the latest common quarter available to your followed funds, and your comparison uses the prices available then, so its values can differ.
The comparison
Each cell is what the vendor's own pages say, in the vendor's terms, on the date in the footnote. Not described means the page does not mention it. A green ✓ marks whichever product leads a row on its own terms.
| Fortunest1 | Dataroma2 | WhaleWisdom3 | GuruFocus4 | Stockcircle5 | |
|---|---|---|---|---|---|
| Coverage |
|
|
|
|
|
| Source |
|
|
|
|
|
| The lag, stated |
|
|
|
|
|
| Compare with YOUR portfolio |
|
|
|
|
|
| Consensus across filers |
|
|
|
|
|
| Alerts |
|
|
|
|
|
| Other 13F tools |
|
|
|
|
|
| Free plan |
|
|
|
|
|
| Paid from |
|
|
|
|
|
Cells were checked against the sources below on 7 September 2026. GuruFocus refused a direct fetch of its pricing page, so its coverage figures come from its own membership announcement; prices there are marked not readable rather than guessed. Prices are each vendor's list price before promotions and, for Fortunest, before VAT. "Not described" is a statement about those pages on that date, not about the product.
The verdicts
Fortunest — our pick
Best for: reading filings against your own weights rather than on their own.
Free — follow 2 investors · Pro €6.99/mo or €69/yr for the roster and the group
Every other product here answers “what does this manager hold?”. Fortunest answers “what does this room hold that I do not?” — because the filings sit inside a dashboard that already knows your portfolio. The consensus table prints your weight beside the group's and the gap between them; the blind-spot filter is one click; the group's regions, sectors, caps, types, currencies and classes line up against your own; and the same consensus can be given a weight in the trade scoring. The caveats are stated everywhere they matter, including on the reconstructed return curve.
Where it falls short: the roster is 25 curated filers, not thousands — if you want an obscure fund, GuruFocus Premium Plus is the answer; the free plan follows only two of them; there is no 13F backtester or screener of the WhaleWisdom kind; and Social needs a free account, so guest mode does not reach it.
Dataroma
Best for: reading superinvestor portfolios free, with no account.
No pricing described on the pages we read
Dataroma has been the plain-HTML reference for this for years, and its restraint is the feature. “Invest Alongside Superinvestors”, 83 of them, holdings ranked by portfolio weight with current prices, 52-week ranges and an ownership count across managers, plus a Grand Portfolio aggregating 1,864 stocks worth $1.148 trillion — which is a consensus view by another name. Insider buying sits alongside, and an RSS feed carries updates.
Where it falls short: the pages we read never name 13F filings, describe the update timing, or state the 45-day lag, so a newcomer can easily read a quarter-old snapshot as today's book. There is no comparison against your own portfolio, no email alerting described, and no stated pricing or account model.
WhaleWisdom
Best for: testing 13F ideas rather than just reading them.
Free tier · Standard $90/quarter · Pro $150/quarter · Enterprise on request
The analyst's tool of the group: a backtester, a Combined Holdings report, a 13F stock screener, a 13F heat map, a fund performance evaluator, an Excel add-in and a developer API, described as giving you “the access and tools to invest like a Wall Street money manager – at a Main Street price”. The free tier is unusually generous — two years of 13F data, unlimited email alerts, five-member fund groups, five-stock watchlists and backtesting — and Enterprise adds nightly FTP files for 13F and Schedule 13D/G.
Where it falls short: pricing is quarterly and adds up ($360 or $600 a year); the number of filers covered, and how quickly data appears after a filing, are not stated on the pages we read; and nothing describes comparing a fund's book against your own.
GuruFocus
Best for: the widest possible universe of filers.
Prices not readable on the pricing page we fetched
Nobody here covers more. Premium gives access to 144 hand-picked gurus; Premium Plus “tracks the trades and portfolios of all the institutional investors that file 13F and 13D/13G forms”, with 4,000+ of them and 18,000+ guru portfolios, and lets subscribers build a Personalised List of Gurus and follow their trades on the site or by email alert. Adding 13D/13G to 13F is a real difference: those forms carry stake changes that a quarterly holdings report does not.
Where it falls short: the site refused our fetch of its pricing page, so we cannot quote a price — check it yourself before subscribing. The guru data is a paid tier rather than the free product, the filing lag is not stated on the pages we read, and whether any of it can be compared against your own holdings we did not check.
Stockcircle
Best for: cheap, fast notifications when a followed investor trades.
Free tier · Pro $8.25/mo billed annually, or $16.49/mo
The consumer end of this category: “Follow in the footsteps of the world's best investors and explore their investment portfolios”, 50+ gurus, built on SEC data its FAQ describes plainly — “Significant transactions and holdings in publicly traded companies have to be reported to the SEC by investors and funds.” Pro adds instant notifications, unlimited trade history, congress trading data, a screener and AI earnings-call summaries; without it you get one monthly recap email.
Where it falls short: “instant” is instant relative to the filing, not the trade, and the 45-day lag is not mentioned on the pages we read; there is no comparison with your own portfolio; and the marketing leans on past pick performance in a way the filings cannot support.
How we compared
We picked the four products people name most often when they ask where to follow super-investor filings, and read each vendor's own home, feature and pricing pages rather than reviews. Where a page says nothing about a row, the cell says so; where a site refused our fetch, we say that too rather than filling the gap. We build Fortunest, so we are not neutral, and our own limits are in our verdict alongside everyone else's.
Questions people ask
What is a 13F filing, and how late is it?
A fund managing $100M or more in US-listed stocks must report its holdings to the SEC every quarter, within 45 days of quarter end. So what you read is a quarter-end snapshot published up to 45 days later: a position opened last month is not in it, and a position bought and sold inside the same quarter never appears at all. That is the whole basis of every super-investor tracker, including ours, and no product can be fresher than the filing itself.
Can I see Warren Buffett's portfolio and compare it with mine?
Yes. Berkshire Hathaway is one of the 25 filers on Fortunest's Super Investors roster; follow it and its portfolio sheet opens with holdings by filed weight, a sector breakdown and a quarterly changes card. Group portfolio then puts the room's consensus beside your own weights — breadth, average holder weight, group weight, your weight and the gap in percentage points. Dataroma, WhaleWisdom, GuruFocus and Stockcircle all show the filings; comparing them against your own portfolio is not described on their pages.
What does a 13F not show?
US long positions only. No cash, no shorts, no bonds and no non-US listings, so a manager's European or Indian book is simply absent. Filed options — which 13Fs report at headline-inflating notional share counts — are excluded from Fortunest's holdings and disclosed as a percentage instead. And a market maker's filing is not a conviction list, which is why two of the roster's blurbs say so outright.
Is the return shown for a super investor their real performance?
No, and any product that implies otherwise is overselling. Fortunest reconstructs the curve by holding quarter-end filing weights between filings and pricing them on total-return history: an approximation of the filed book, never the fund's actual performance. When less than 70% of the filed value can be priced, no curve is drawn at all rather than a fictional one, and Super Investors never enter the social leaderboards because a synthetic curve should not race real track records.
Can I follow super investors for free?
In Fortunest the free plan follows any two of the 25 filers, with a free signed-in account; the whole roster, the investor group portfolio, the consensus criterion in scoring and consensus-shift alerts are Pro at €6.99 a month or €69 a year. Dataroma publishes 83 superinvestor portfolios with no pricing described on its pages; WhaleWisdom's free tier covers the past two years of 13F data with unlimited email alerts; Stockcircle's free tier sends one monthly recap email.
Sources
- Fortunest — the Super Investors and Group portfolios sections, the Group consensus criterion, Explore tables and plans and pricing.
- Dataroma — home and the Grand Portfolio (7 September 2026).
- WhaleWisdom — home and pricing (7 September 2026).
- GuruFocus — the PremiumPLUS membership announcement (7 September 2026); pricing refused our fetch that day.
- Stockcircle — home and FAQ and Pro (7 September 2026).
Signals, analyses and assistant answers in Fortunest are informational — not financial or tax advice. Delayed 13F holdings are a record of the past, not a forecast.