Documentation
Investment Simulation
The Simulation tab answers two questions before you act: what would this trade do to my portfolio right now, and where does my plan take me over the years. Inputs and results persist across tab switches.
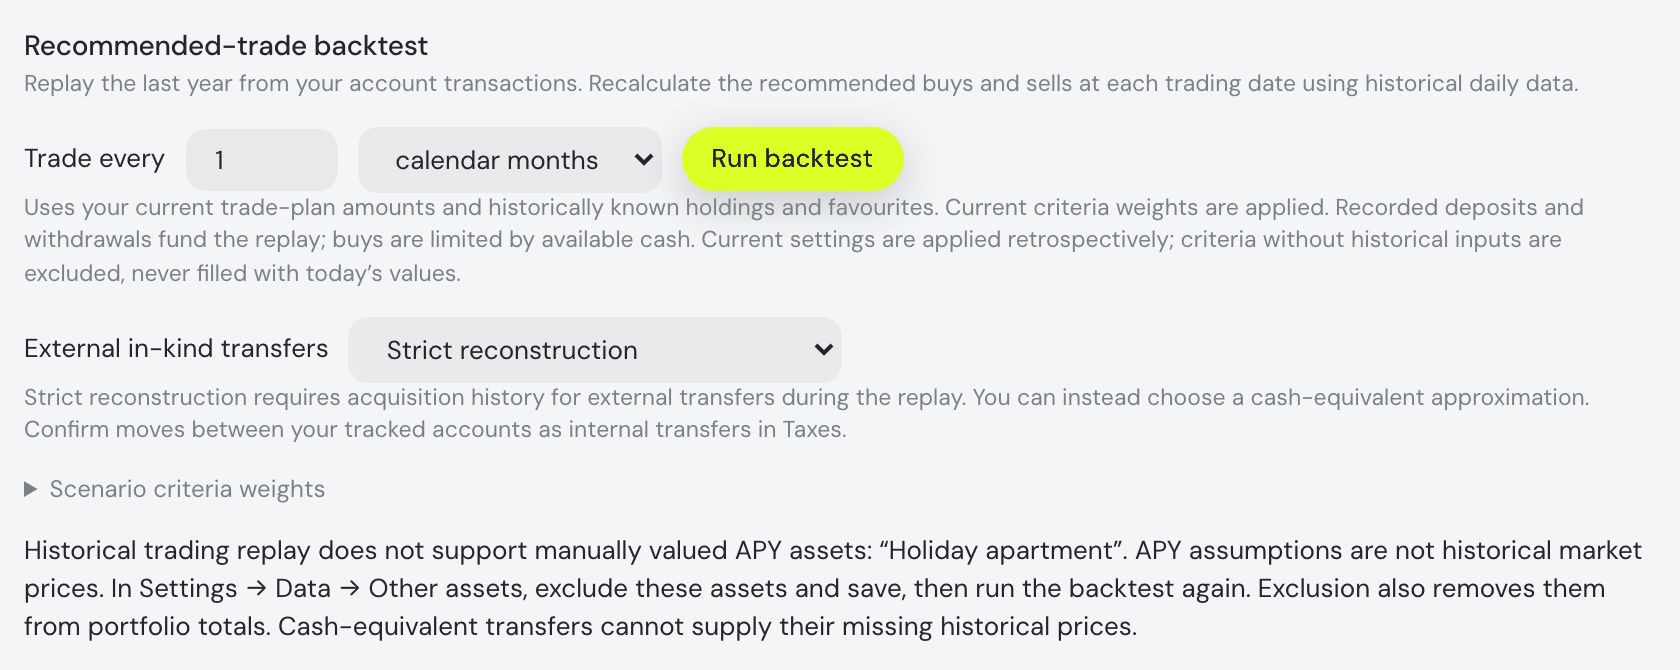
Historical replay checks for APY-valued manual assets before starting. The explanation names them and points to Settings → Data → Other assets: exclude the asset, Save, then retry. This exclusion also removes it from tracked portfolio totals. An APY assumption is not a daily market-price history; cash-equivalent transfer mode does not change that. Market-tracked manual assets remain eligible when sufficient price history exists.
When your portfolio changes: an earlier result is marked out of date. Future simulation recalculates using current holdings; What-if retains your trade inputs and asks you to Simulate again. Late responses from the old portfolio cannot replace the newer result. A saved comparison from the old holdings snapshot is cleared, and refresh during Goal seek Apply keeps the original Undo inputs.
Assistant and external-agent simulation commands apply the requested lookback and horizon to the calculation immediately. A goal request waits for its solved plan; automatic form recalculation does not replace that request while it is running. Commands can return from Historical to DCA or Goal seek using the same authorization.
Backtest recommended trades
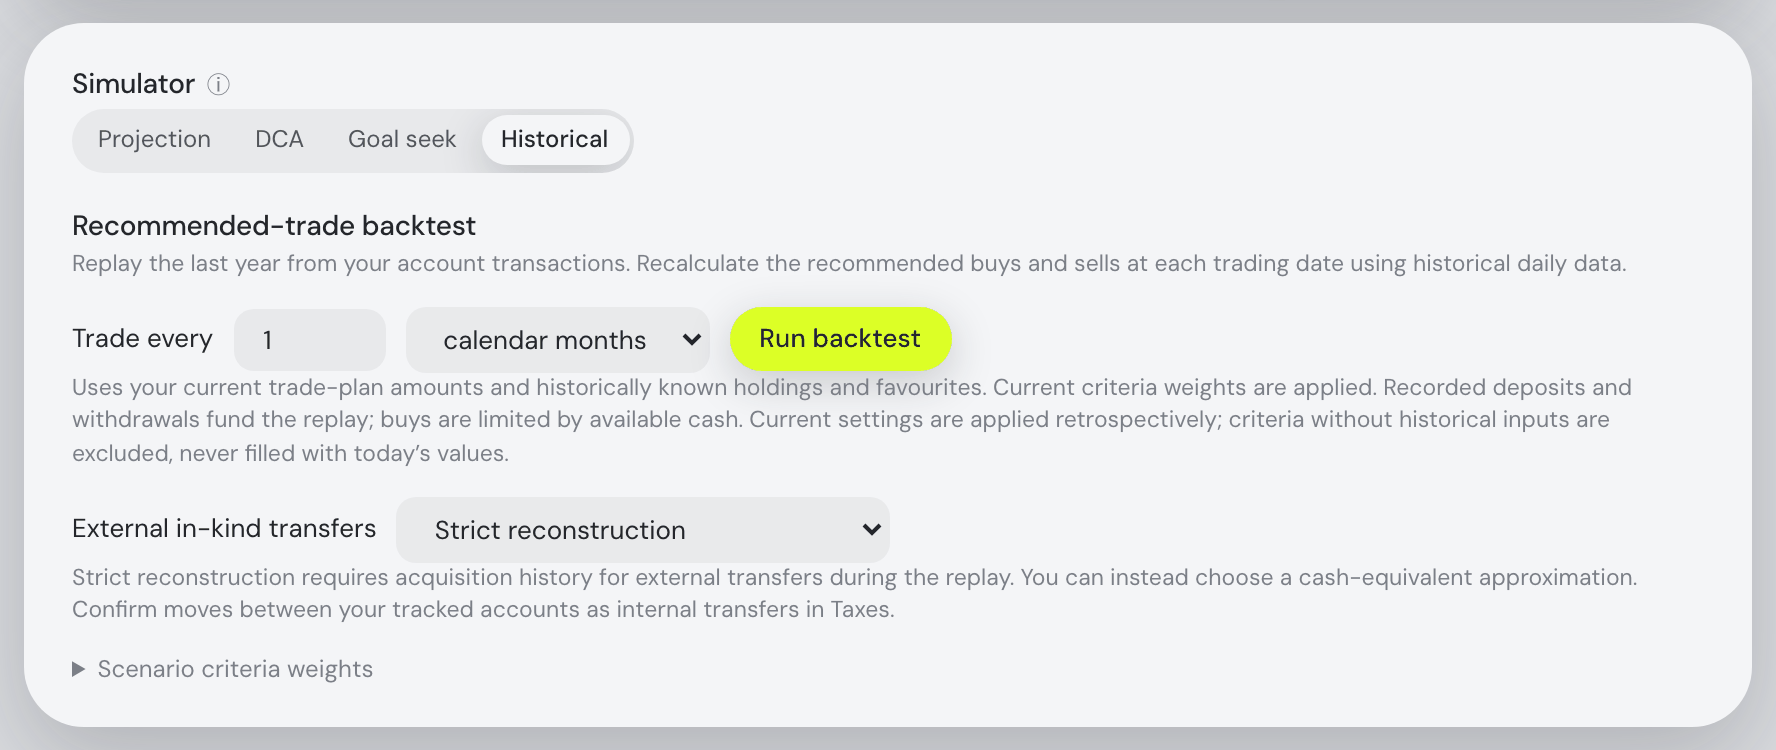
Choose Backtest trade plan on Trades. Simulation opens with Historical · recommended trades selected and runs automatically. The existing Future · DCA & goal seek strategy remains available. Set a trading period in calendar months (monthly by default) or days, adjust the local criterion weights, and choose Run backtest to compare scenarios. Use saved weights restores your saved criteria; Reset defaults restores the company-rating defaults. These standard flat secondary buttons are disabled while a run is active. These controls do not change saved settings or place real trades.
The replay starts with the portfolio reconstructed from dated account transactions a year ago, or the earliest available transaction if newer, and ends yesterday. Current planner settings, targets, tax rules and budgets are fixed retrospective parameters. The replay uses the same simplified planner with recorded external flows; it does not invent deposits from Invest. Holdings at the start and still-saved favourites after their recorded addition dates form the candidate universe; deleted watchlists are not archived.
Each decision uses only prices and reports available by that historical close. SEC financial facts become usable the day after filing, including the versions available then. Orders execute at the next observed daily close within seven days. Current analyst targets, forward estimates, sector classifications, fund look-through and valuation anchors are excluded. Other criteria use the historical inputs available for that asset. Missing classification or insufficient quality/valuation evidence leaves the company unrated. The coverage table reports each exclusion and partial reconstruction, including trailing paid dividends instead of today's indicated yield.
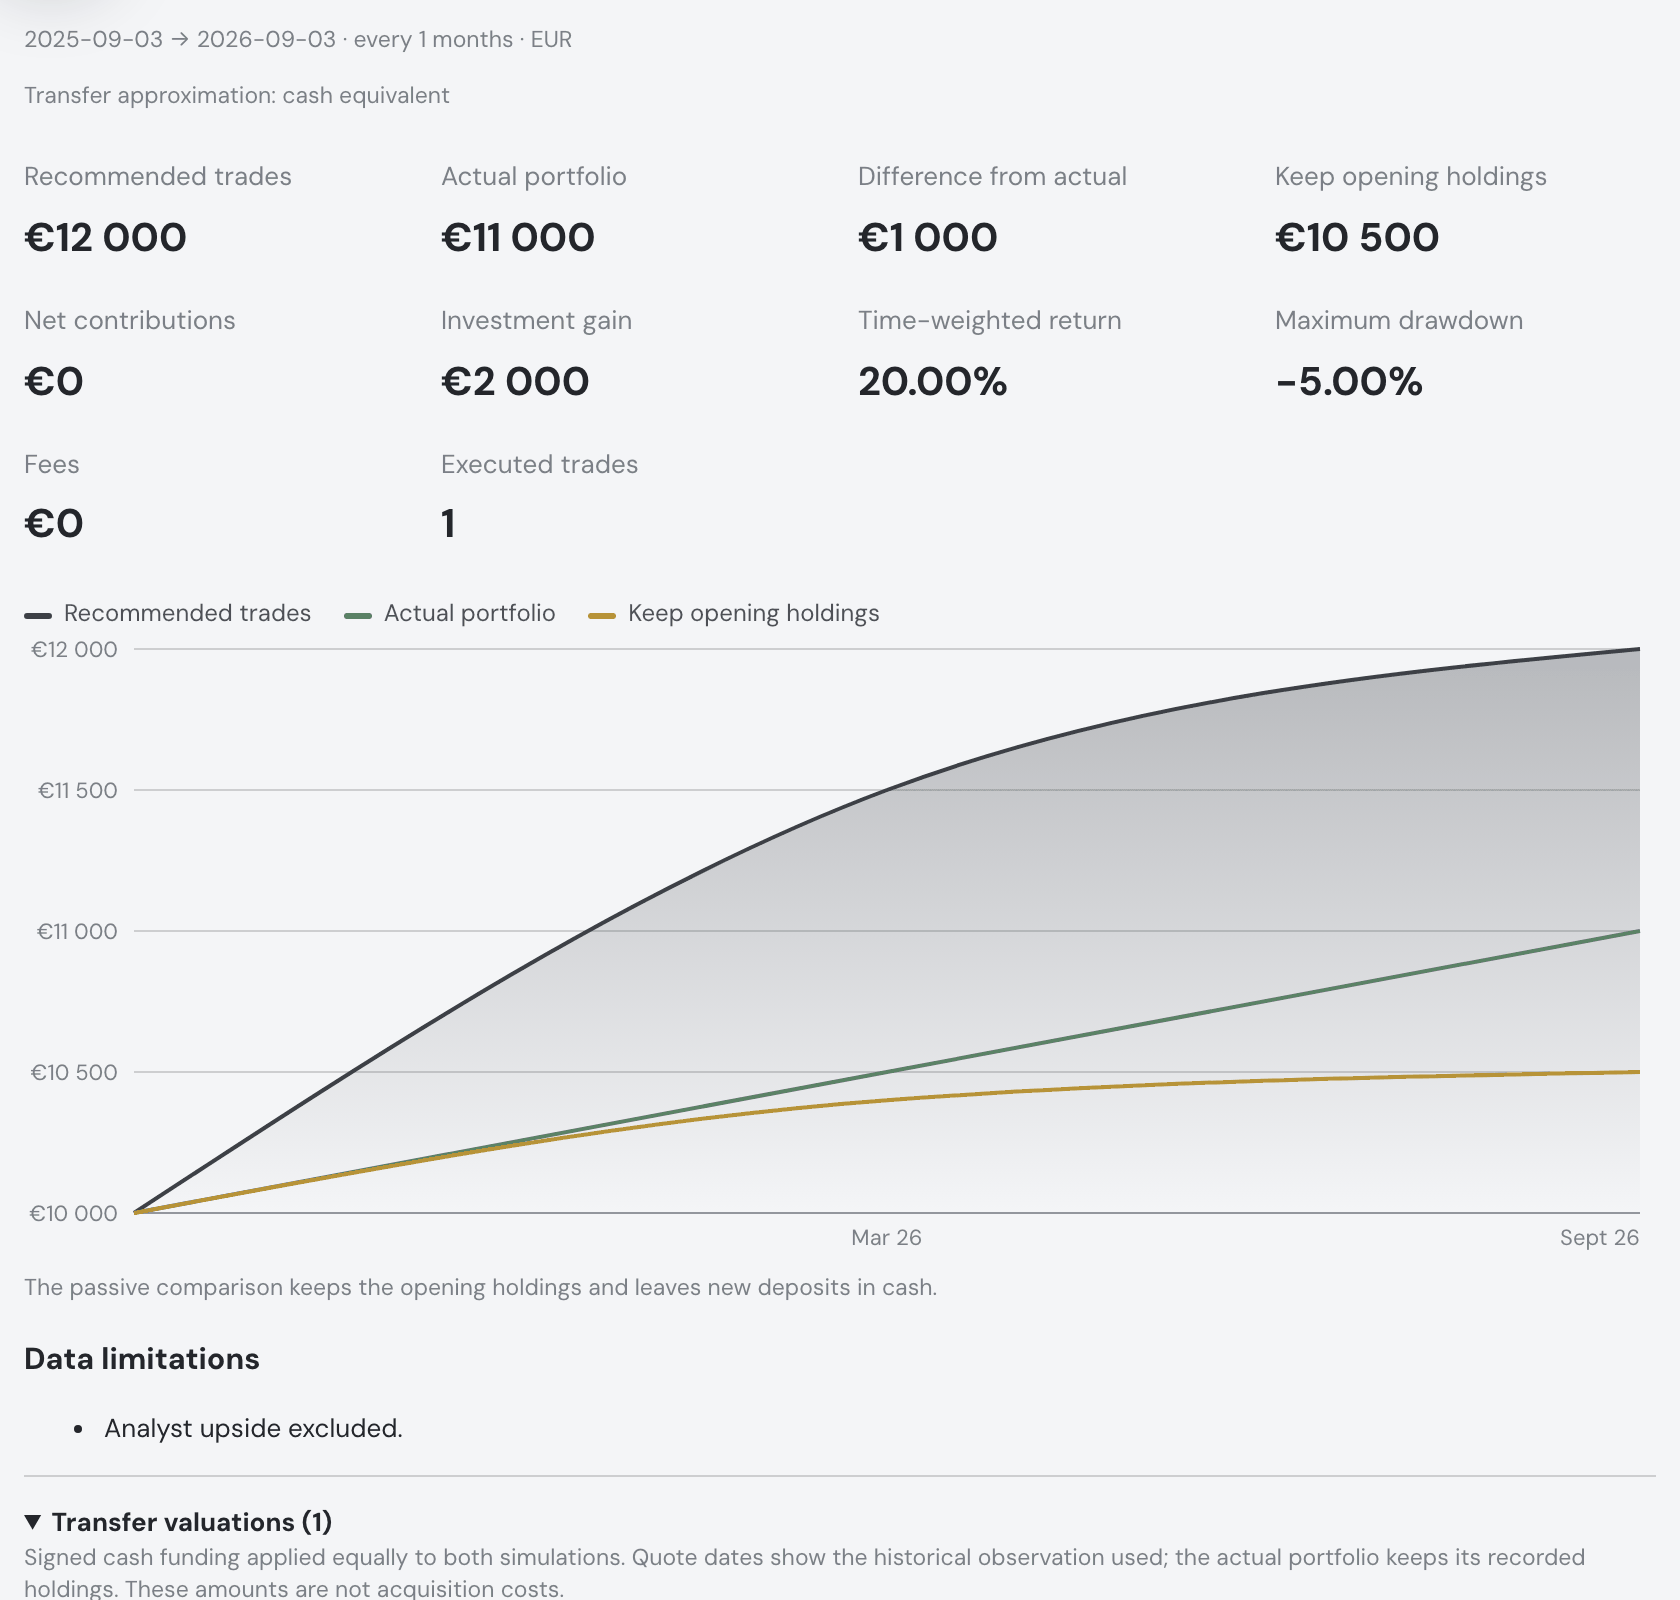
The chart compares the actual account history, the simulated recommendations and holding the opening portfolio with new deposits left in cash. Both simulations use the same external flows. Buys use available cash; sales do not enlarge the requested buy amount. There is no leverage. Splits change quantities and unit costs; dividends enter cash on ex-date. The assumptions include fractional shares, zero fees/slippage and no tax payments. Unknown lot costs leave tax coverage unavailable and use FIFO for disposal. Accounts without a cash ledger use recorded trade funding as deposits or withdrawals.
External in-kind transfers defaults to Strict reconstruction. If acquisition records are missing, you can explicitly choose Cash equivalent (approximation): recorded transfers during the replay become equal cash deposits or withdrawals for the recommended and passive simulations. Each uses a historical price on or before the transfer, at most seven days old, converted using FX available on or before that quote date. Transfers add incoming assets to the candidate universe from their recorded arrival date; existing holdings and historically recorded favourites keep their earlier eligibility. The actual portfolio stays unchanged, and the passive simulation leaves incoming cash uninvested. Results label the approximation and list each transfer's account, quantity, quote date, price and cash amount. These amounts are not original acquisition costs.
Inferred balance corrections have synthetic dates and still need missing transaction records imported through Settings → Data. Unresolved instrument identifiers need a correct market-data mapping and dated observations; they cannot be priced at zero or at today's price. A quote preceding an intervening split cannot value post-split units. Confirm genuine moves between your tracked accounts in Taxes so they are treated as internal transfers.
Expand the results to inspect signal and execution dates, order reasons, final
holdings and assumptions. Inferred balances from a later account snapshot, missing
historical prices/FX or unknown distributions during exposure stop the run with
an explanation. This is a reconstruction with explicit coverage, not an archive
of exact past app output or vintage provider data. No current numeric metric fills
a historical gap. Jobs can be cancelled and expire from memory; reloading the app
does not preserve a run. If a run disappears after a server restart, choose
Run backtest to start again. Launching while one is active queues
the latest request; it starts when the current run finishes or is cancelled.
The assistant can launch it with backtest_trades.
Historical inputs are cached on the server. Daily prices, corporate actions, exchange rates and SEC company facts are stored separately from temporary simulation jobs and survive server restarts on the deployment's persistent volume. Running another scenario reuses valid cached inputs; the historical-data progress counts preparation of each symbol, including cache reads, so it does not mean every symbol is being downloaded again. Successful SEC documents stay fresh for a day. A failed refresh retains valid older data and retries after ten minutes; it does not turn missing coverage into zeros. Refreshing older dividend coverage preserves any wider cached date range.
Under the strategy blocks sit the two windows the projection is built from — Averages over last N months (the lookback the returns are read off) and Simulate N months ahead — a Run simulation button, and the Benchmarks dropdown: S&P 500, MSCI World, Nasdaq 100, US bonds (AGG), Gold, US dollar, Bitcoin and Diversification, each ticked on or off independently. It is the same compact multi-select the Portfolio tab's Portfolio value over time chart uses for its own benchmarks — one pill button naming your picks (the first two, then a +N count) that opens a checkbox list, every row carrying that line's colour. Under it sits the Lines dropdown — Projected with DCA and Projected without DCA — choosing which projected lines the chart draws (see below). A plain-language line above the chart states the result before you read it — how much you would put in over the horizon, where the plan ends up with and without it, and how much of the difference is simply your own new money rather than growth.


The what-if trade simulator
Simulate any buy or sell — an existing holding or a brand-new asset — and see, before placing it:
- the position's new weight in the portfolio,
- the effect on the diversification score, overall and per dimension (regions, sectors, sizes, types, currencies),
- the shift in the portfolio's weighted fundamentals (P/E, growth, FCF yield…).
The trade plan feeds it directly: every plan row's Simulate chip lands here with that order's symbol, side and amount already filled in and run. Selling a held asset also asks your open tax lots for the time-test hints — how much of the sell is tax-free today, and what matures within a year; on the free plan those lots are behind Pro, and the result says so in one muted line rather than silently showing no hint.
Buys spend your broker cash first, so the simulation matches what would actually happen in your account.
The Simulator
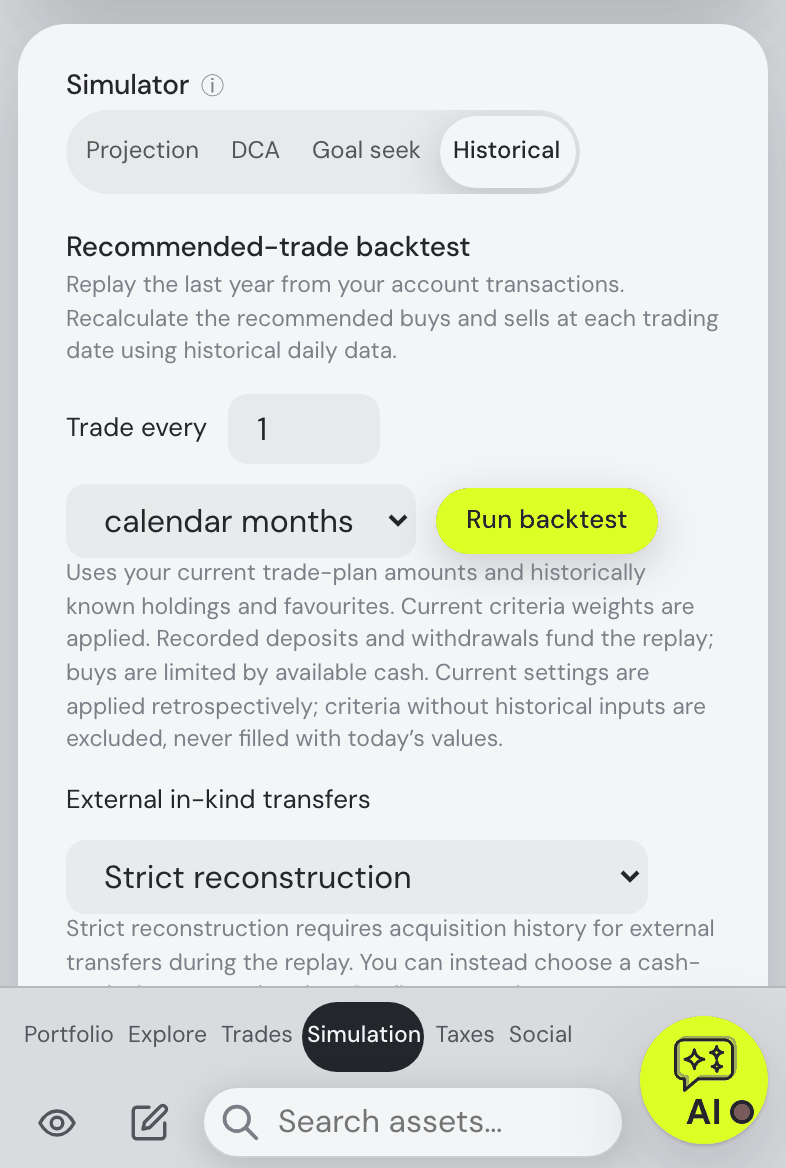
The card’s sliding selector offers Projection, DCA, Goal seek and Historical. DCA and Goal seek are mutually exclusive; Projection runs without purchases. Switching to Historical and back keeps your future plan and inputs. On a phone the four choices stay on one line — they tighten to fit, and on a screen too narrow even for that the strip scrolls sideways rather than wrapping.
Projects your portfolio and the selected benchmarks forward at their lookback-average returns — the lookback window is editable, so you can base the projection on the last year or the whole history. The selected mode and optional withdrawals shape the projection:
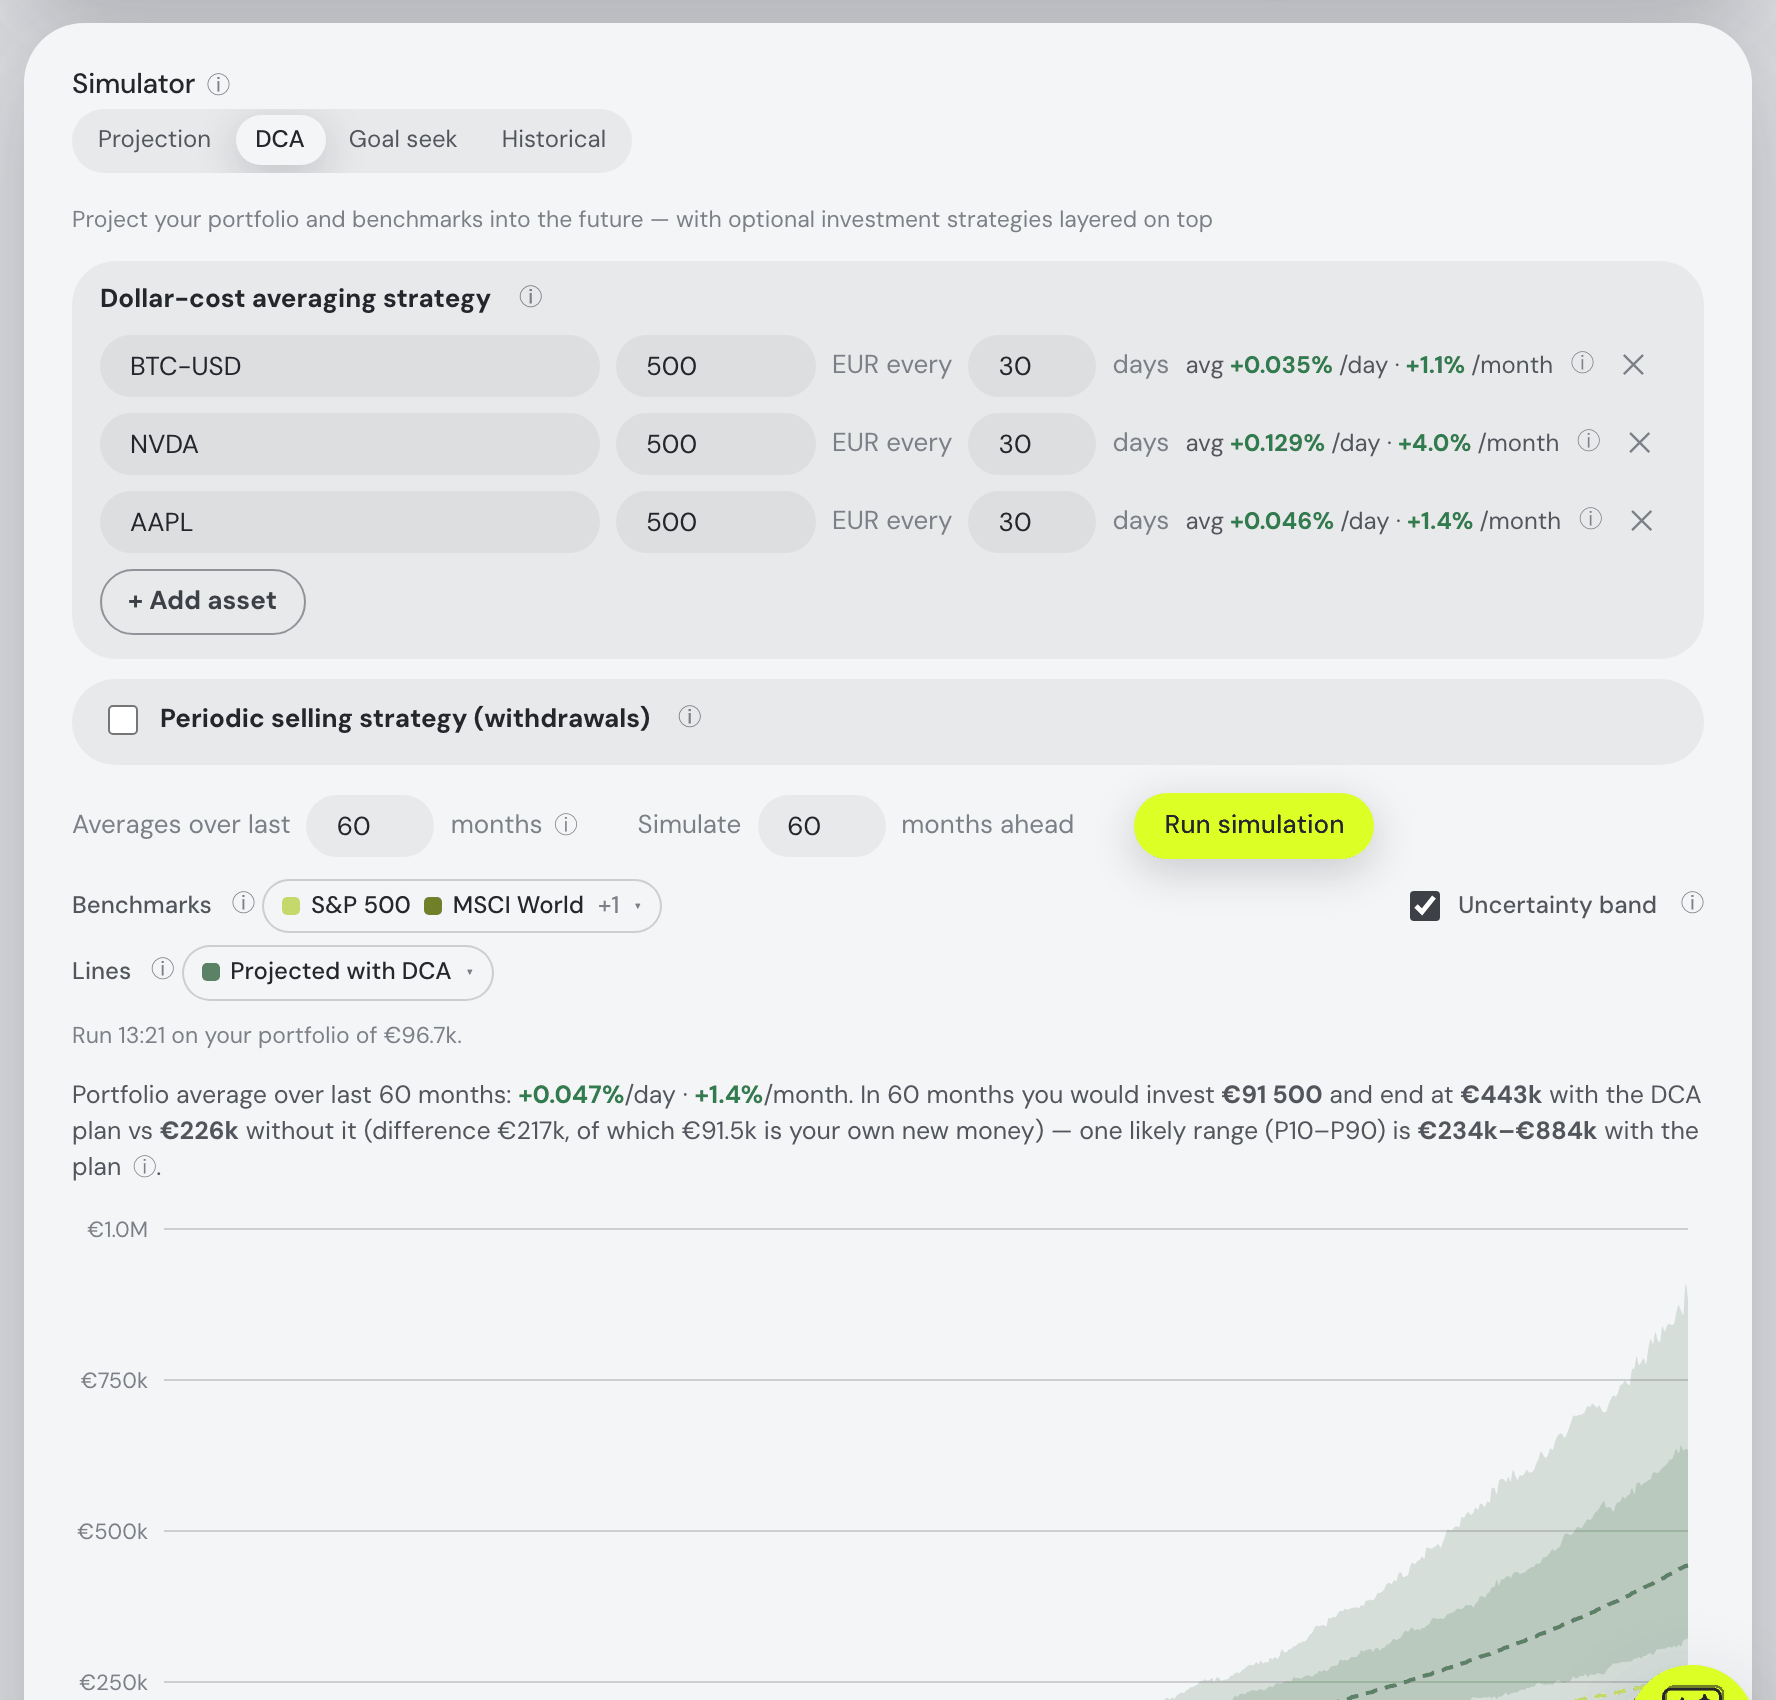
Dollar-cost averaging
Add any number of assets, each with its own amount and period ("200 into an S&P 500 ETF monthly, 50 into BTC weekly"). Per-asset average daily/monthly returns are shown so you can sanity-check the assumptions. The plan is seeded with your top-3 holdings and runs automatically the first time.
Periodic selling
Schedule regular withdrawals to model a drawdown phase — the benchmarks mirror the same withdrawals, so the comparison stays fair.
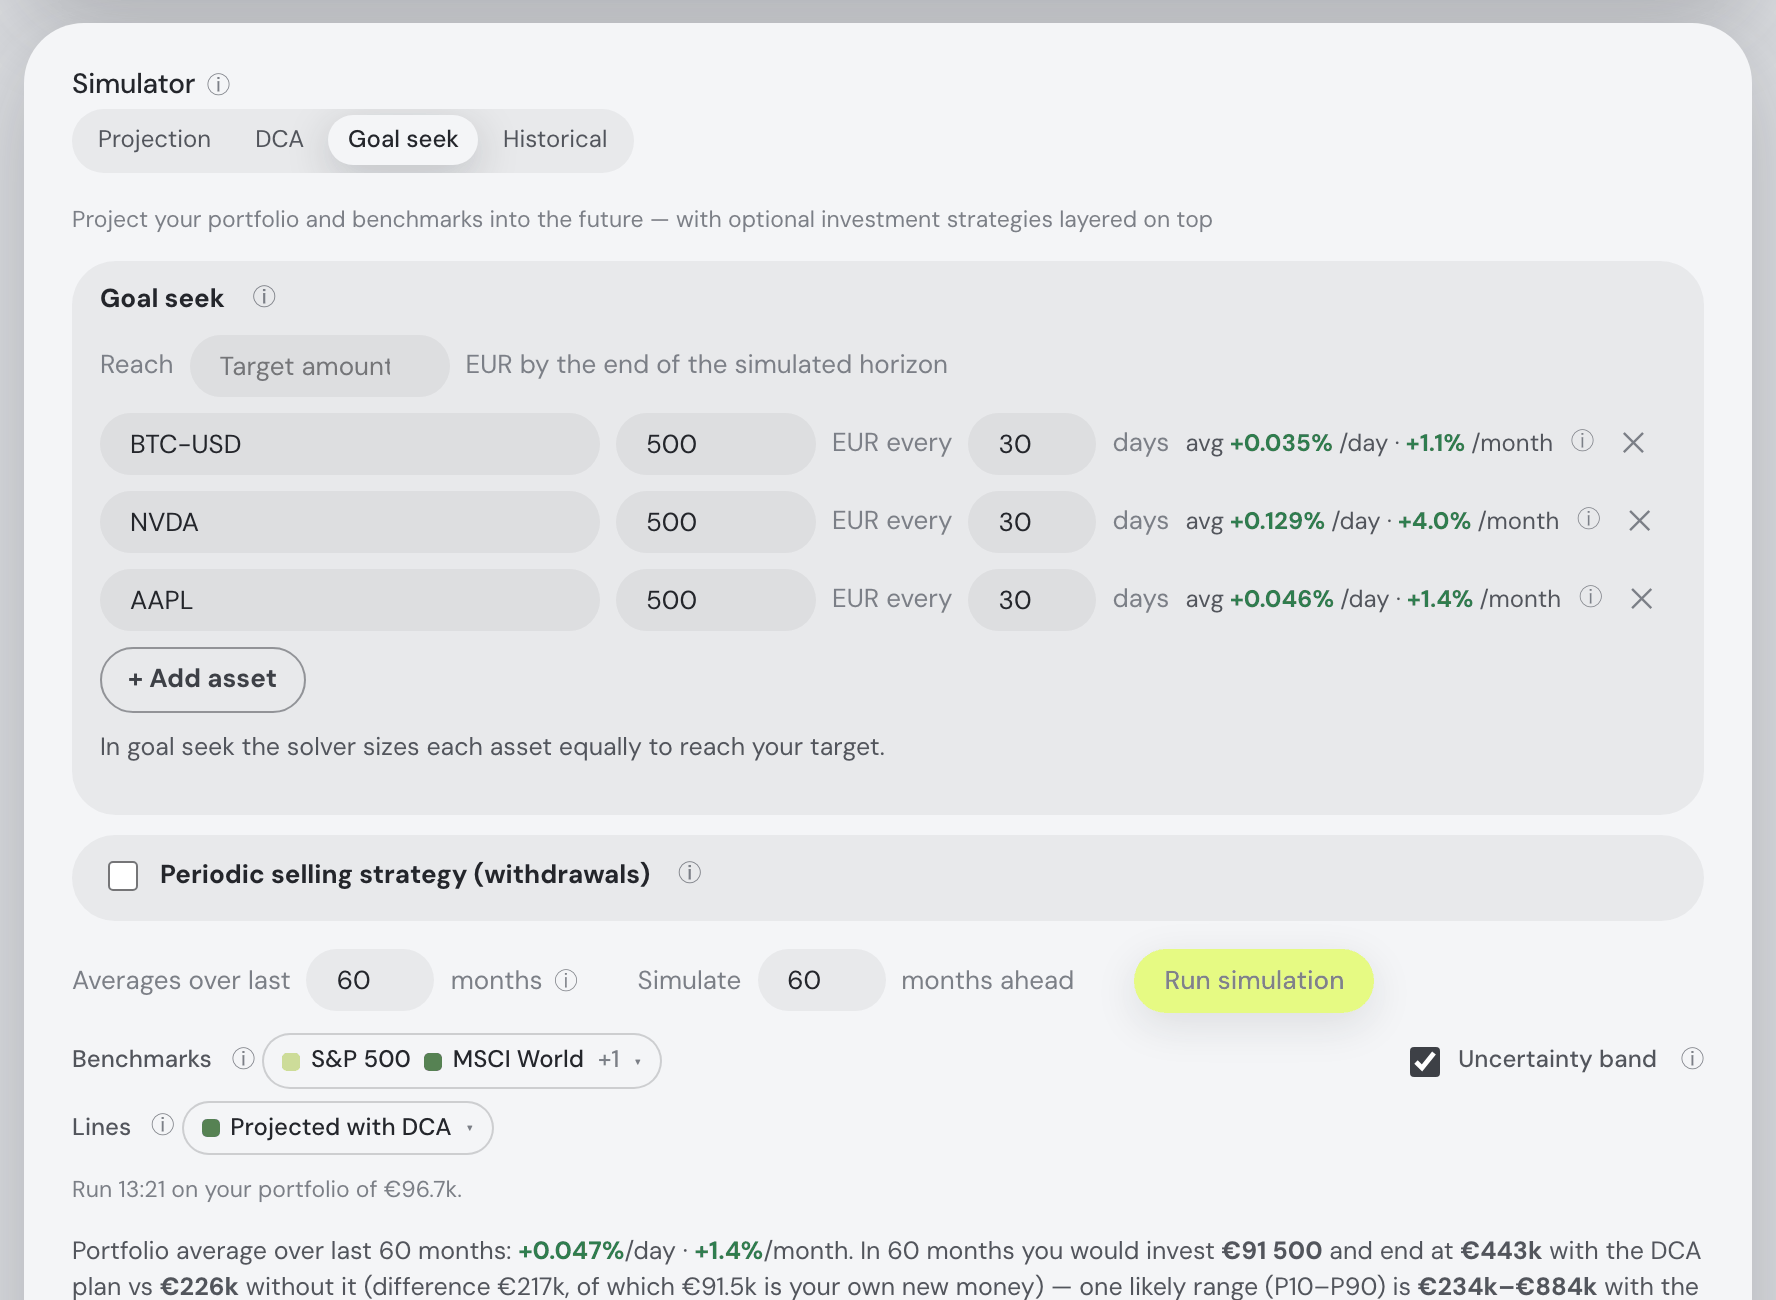
Goal seek
Set a target amount and a horizon, and the simulator solves for how the DCA plan must scale — or what fixed 30-day contribution — reaches the goal. The goal is drawn on the chart, so you can see exactly where the plan crosses it.
Saving, comparing and undoing a run
Since 4 September 2026 a run is not disposable. Save this scenario keeps the run you are looking at — named after its own plan — as a dashed line on the chart and in the legend; every later run is then compared with it in one sentence under the chart (“Saved scenario 200/month into VWCE ends at €412k vs €438k now (+€26k)”), until you press Forget. One saved scenario at a time, so the chart never becomes a thicket.
Apply to plan — which overwrites the DCA amounts with what goal seek solved for — keeps the previous asset rows, typed amounts and periods for Undo, including an originally blank amount. Undo becomes available when recalculation finishes or fails and remains available for six seconds. It restores those rows and re-runs; the target and horizon stay as entered. And while a change is being recalculated, a slim progress strip sits over the existing chart instead of the chart silently being replaced.
The uncertainty band
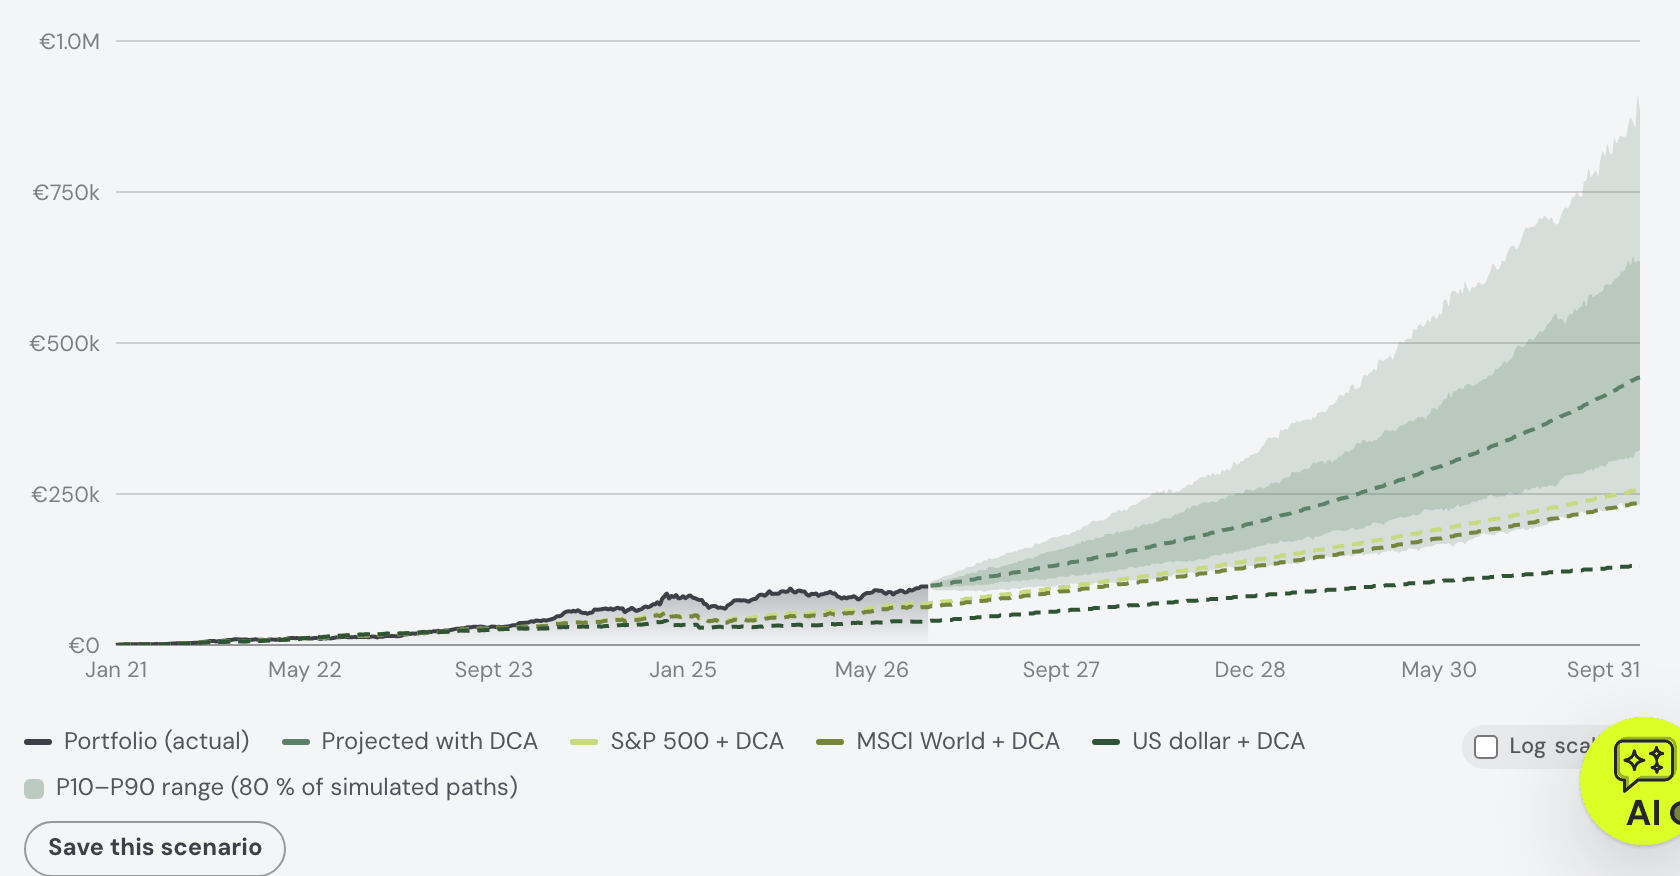
A projection is not one line. Each projected portfolio line (Projected with DCA, Projected without DCA) is deterministic — today's value compounded at the window's average return. Around it the app draws 400 Monte-Carlo paths at the lookback window's own daily volatility — lognormal daily steps, that same average as drift, and your DCA buys and withdrawals happening on every path. The paths' median (P50) sits on the line rather than defining it: the drift is a geometric average with no −σ²/2 correction, so the two coincide by construction. The shaded band behind the line covers 80 % of those paths (P10 to P90); the denser core is the middle half (P25 to P75). The summary sentence adds “— one likely range (P10–P90) is 0.9M–11M with the plan”, hovering a projected day lists P10 and P90 under the line's value and, on a second row, the P25–P75 core, and the ⓘ spells out the recipe (the volatility annualised) and the one assumption to doubt: that the window's average and its volatility persist for the whole horizon. The Uncertainty band checkbox beside the Benchmarks row turns it off for a cleaner chart — on by default, remembered in your browser; the lines do not change. Benchmarks get no band, and a window with fewer than 60 daily returns gets none and says why.
Which projected lines to draw
The Lines dropdown under the Benchmarks row — Projected with DCA and Projected without DCA, every row carrying its line's colour — chooses which projected portfolio lines the chart draws. Every run picks the default from the plan it sent: with DCA selected (or a goal-seek plan solved) only Projected with DCA is on; with no buy plan only the plain projection is on, and the “with” row is greyed in the menu because that run drew no such line. After a run you toggle freely — both on to compare, both off to see just the actual line and the benchmarks (the button then reads none). A hidden line takes its uncertainty band with it, the legend lists only the visible lines (and the band row only while a band shows), and the y-axis re-fits what is left; the summary sentence keeps quoting both end values, because it describes the simulation rather than the chart. The choice is not remembered — the next run (a knob change, a portfolio refresh, the Run button) re-derives it. The assistant can set the pair: set_simulation {lines: {withDca, withoutDca}}.
Reading the chart's vertical axis
The axis fits what is on the plot: it runs from zero to the smallest round number that still covers every visible line, the top of a shown uncertainty band and the goal line — never more than one tick step above the data. A fan reaching €477k tops out at €500k rather than €600k, and switching the band off brings the axis down with it, so the portfolio's own history keeps its share of the plot instead of being squashed along the bottom.
A Log scale checkbox sits under the plot's bottom-right corner — the same control the Portfolio tab's Portfolio value over time chart carries. On a logarithmic axis every step is an equal percentage rather than an equal amount, so a compounding projection straightens into a line and the near years read as clearly as the far ones. A log axis has no place for zero, so it starts at the smallest positive value in view. It is off by default, remembered in your browser, and shared by Projection, DCA and Goal seek, which draw the same chart.
The simulation chart also draws the diversification score — historical and projected — so you can see whether a plan concentrates or diversifies the portfolio over time.
Projections extrapolate past average returns; they are scenarios to reason about, not forecasts. The assistant can discuss the simulation you just ran — it's part of its context (see The Assistant).
What-if refreshes its sell-lot access state for a changed portfolio, discards obsolete permission errors and shows no directional arrow when a score is unchanged.