Documentation
The Trades tab
Company ratings, explicit targets and a clear reason for every planned or skipped trade. Free on every plan.
Illustrative only. Check suggestions and tax estimates against your records. No broker orders are placed.
The simplified planner
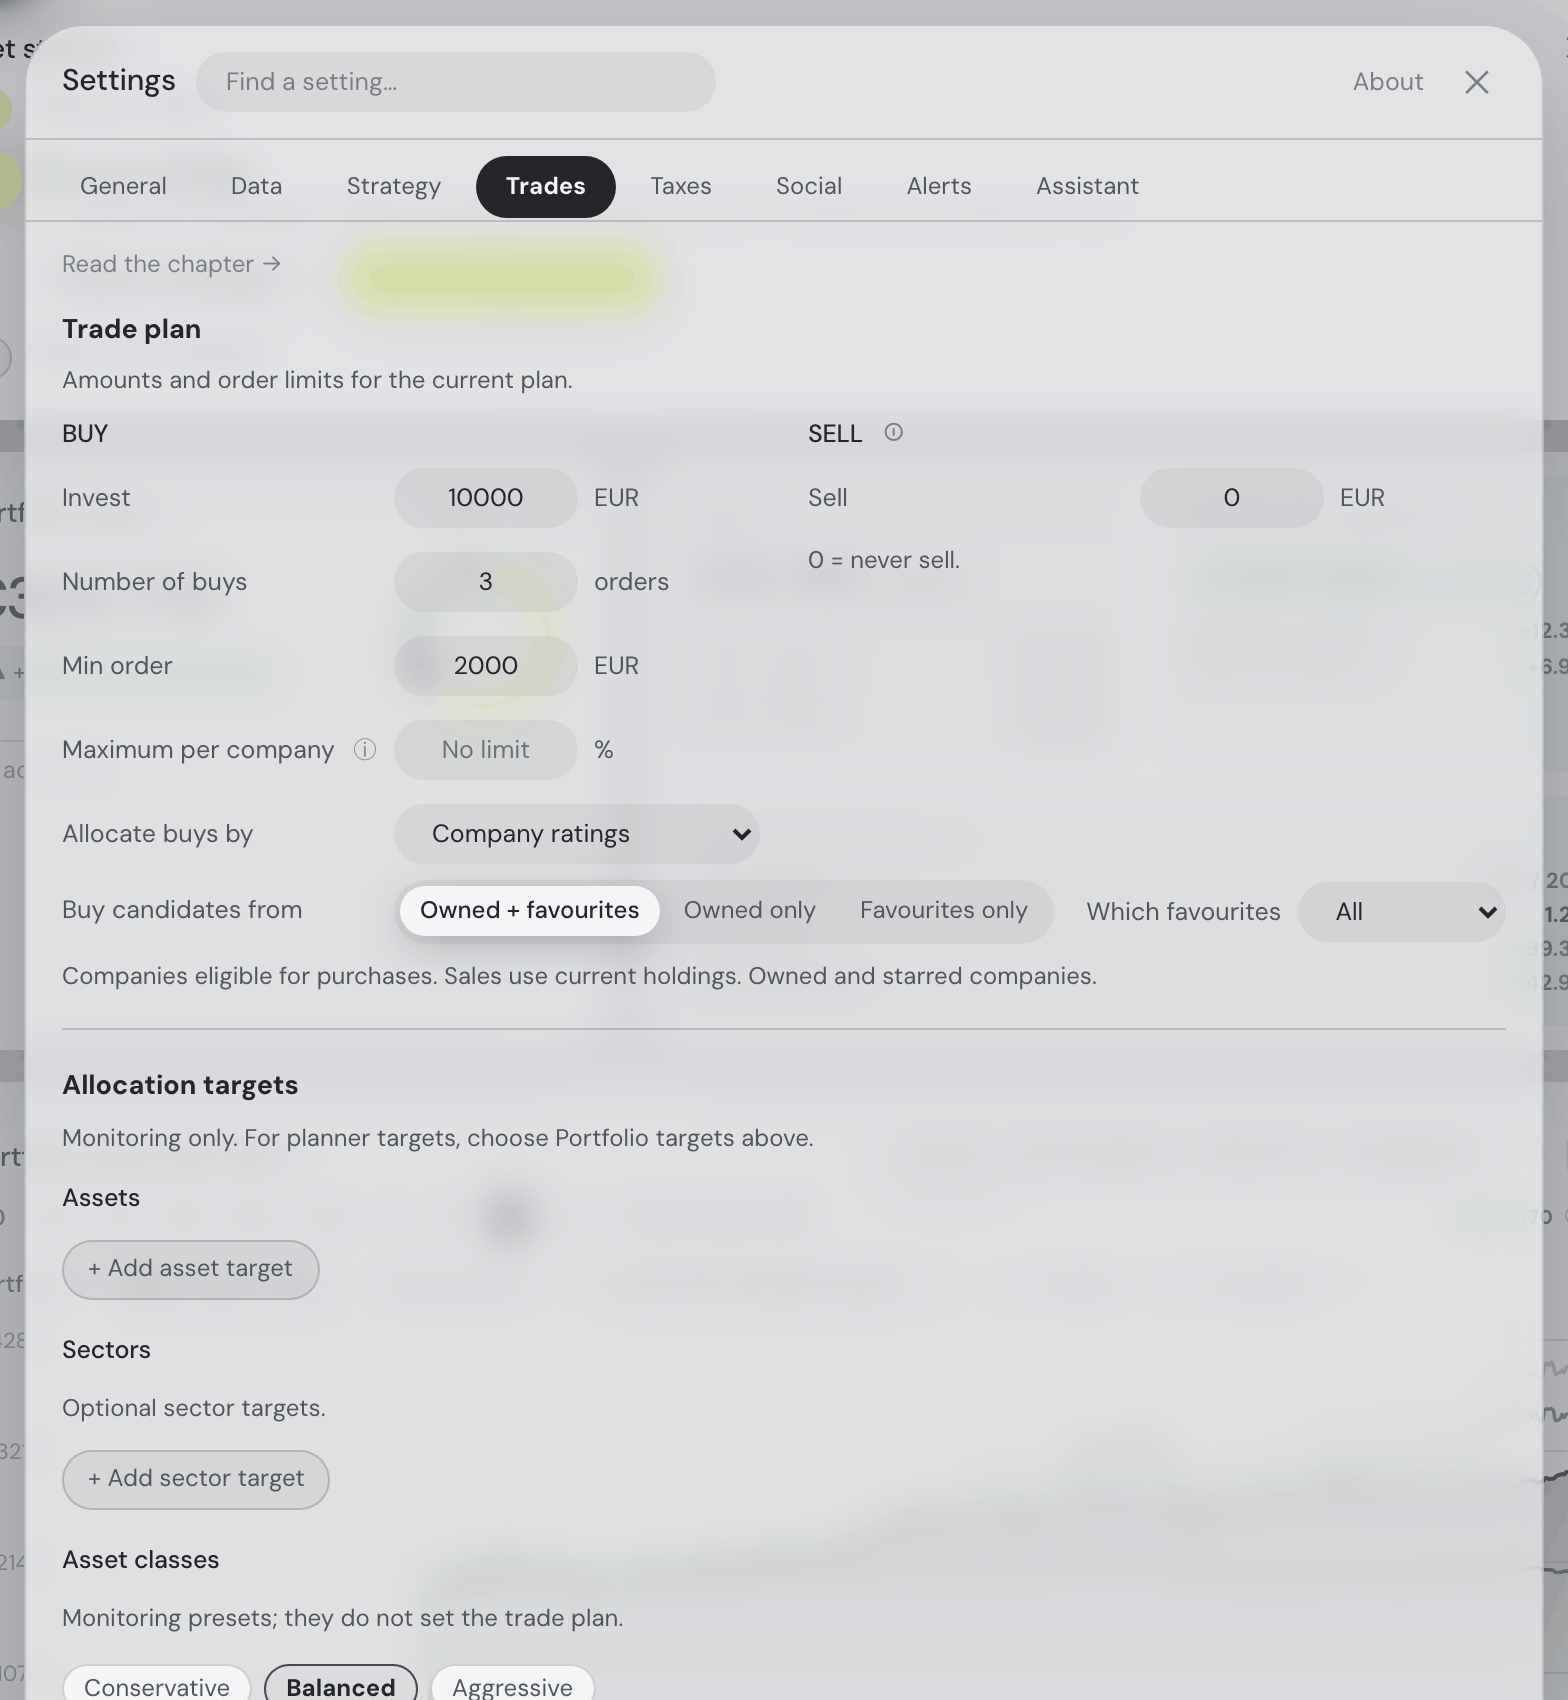
Targets decide the split; one company rating orders the stocks. In Settings → Trades, choose Company ratings for stock selection alone, or Portfolio targets to maintain a mix of selected funds, crypto, individual stocks and cash. Existing allocation-monitoring targets do not activate this plan.
The rating is 0–100, with 50 neutral. Buys start with the highest-rated eligible companies; sales start with the lowest-rated holdings, after required company-limit or target reductions. Funds and crypto follow explicit targets and have no company rating.
Maximum per company is unset by default. Set it to limit a company’s share of the portfolio after the plan. The limit can reduce a buy or exclude it; known share classes count together. It does not apply to funds or crypto.
Each candidate keeps its rating and shows its plan result beside its rating drivers: In plan, Company limit reached, Capped by company limit, Order limit reached, or another short reason. Constraints change the order, not the rating.
Example: Invest 30,000 and Sell 15,000 plans up to 30,000 of purchases and 15,000 of sales. The 30,000 is new money; sale proceeds stay cash. Limits, targets and minimum orders can leave money unspent.
The decision ribbon
A compact view of the current plan and tax-lot timing. Open the related card for the orders or lots behind it.
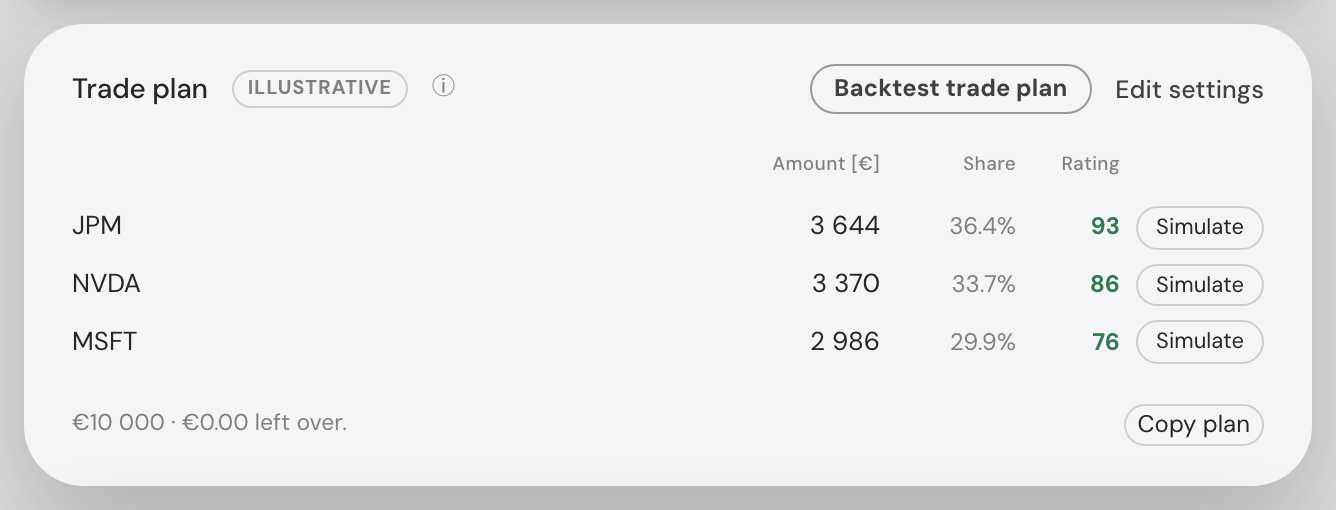
The trade plan
One divider separates Buy and Sell. Orders show useful reasons, without repeating “In plan”.
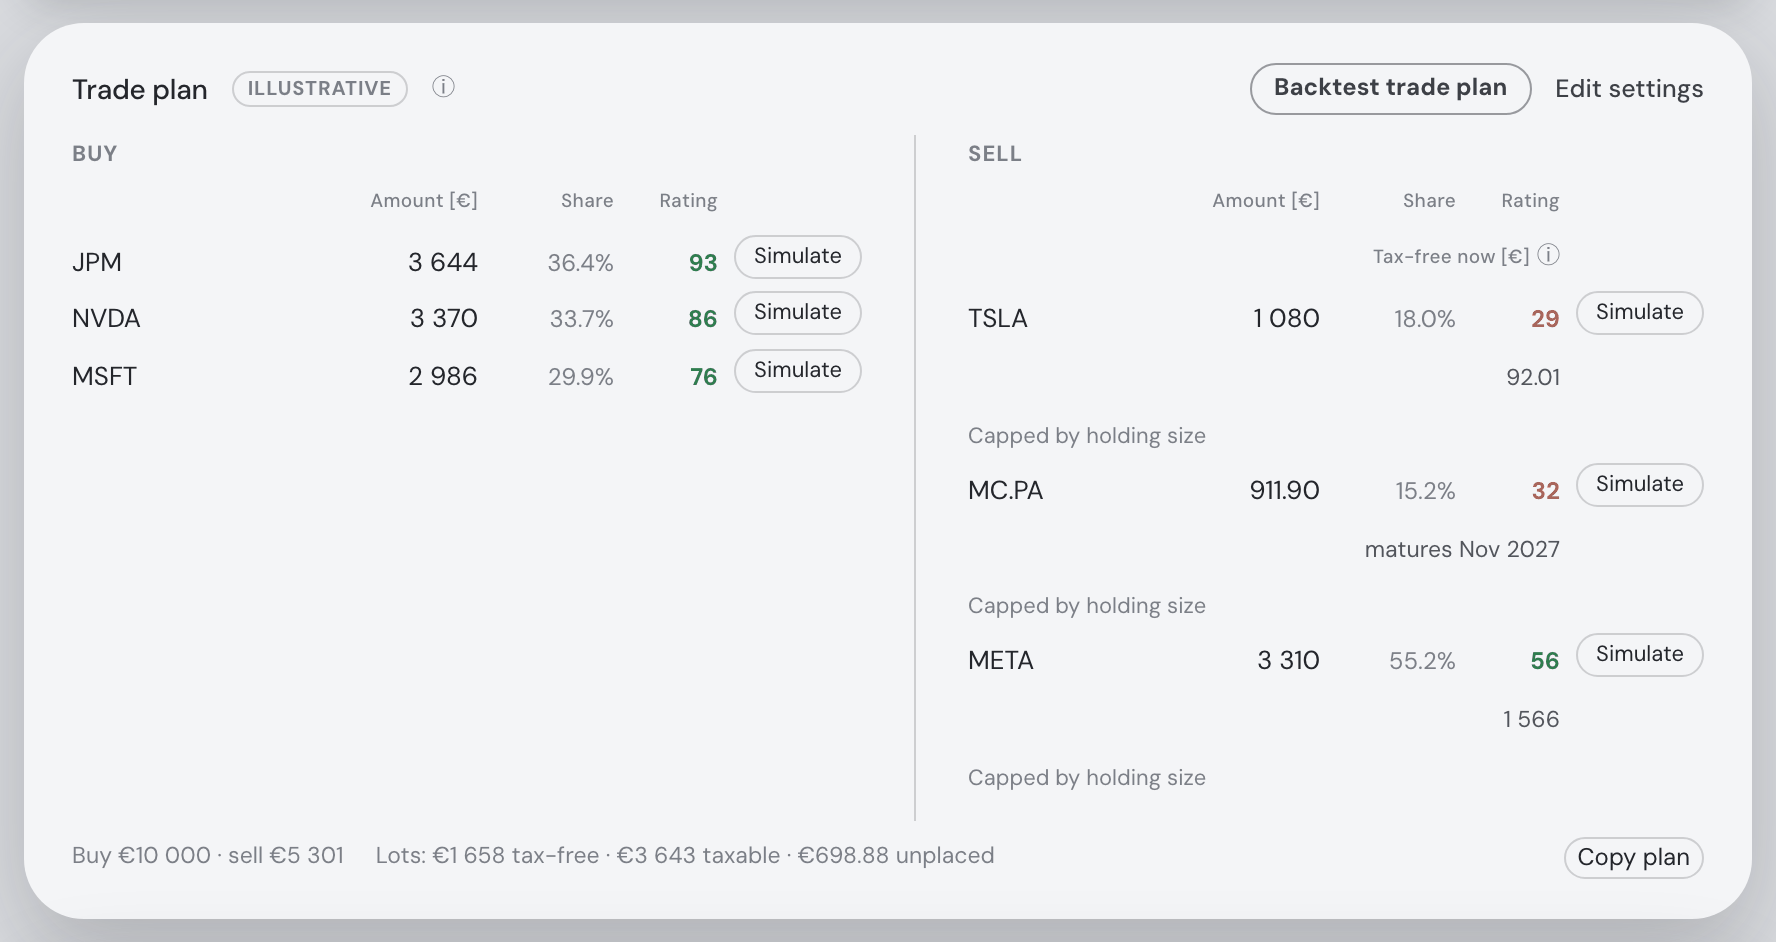
Each list labels its columns: Amount, Share and Rating on both sides, and Tax-free now as well on the Sell side. Amount and Tax-free now name your display currency in the label, for example “Amount [CZK]”, so each row prints just the number. Rating is the company rating the plan ranked by, rounded and coloured as in the candidate tables: green from 50, red below, a dash when the company has no rating. Tax-free now is the most of that holding you could sell today without income tax (see Reading the table). When nothing has matured yet, the cell says when the next lot does — “matures Nov 2027” — with the exact date and the quantity behind it on hover. A dash is left only where there is nothing to date: no tracked lots, matured lots with no current price, or lots the configured rules apply no time test to. The ⓘ next to the Tax-free now label carries the rule. Every row also has a Simulate chip beside it, which never runs into those figures: where a list is too narrow for five columns — a phone, or the Buy|Sell pair in a small window — Tax-free now takes its own line under the row.
- Set the money. Invest is a new contribution, added once to the portfolio value used for limits and targets. Sell is independent; its proceeds stay cash.
- Choose the split. Targets mode reserves the deficits of explicit fund/crypto targets and the individual-stock bucket, using the post-contribution portfolio value. Cash and unfillable buckets stay cash.
- Choose eligible orders. Buy list, data coverage, company capacity, available price, order count and minimum size all apply.
- Size stocks. Split purchases proportionally to each rating and sales to 100 minus the rating, with a minimum weight of 1. Company capacity and minimum orders still apply.
- Plan sales. Sell 0 disables sales. Otherwise, company-limit and target reductions take priority, followed by the lowest ratings, within the sell budget and holdings.
Tax estimates and lot coverage are informational; they do not block or postpone sales. Sale-selected assets, including known share classes, are excluded from buys: no asset is bought and sold in the same plan.
Each order shows its amount and any cap. Unspent money and fewer orders are explained. These are suggestions; the app does not place broker orders.
The card’s heading holds its two actions at the right: Backtest trade plan and Edit settings. Its last line sums the plan up — what is bought and sold and, when you sell, how much of it your lots cover tax-free — with Copy plan at the right, which puts the whole plan on the clipboard as plain text.
Backtest the plan with historical data.
Net amount
Net amount is purchases minus sales; it does not measure new money. Company ratings are never reduced by tax or an opposing sell score.
Recent trades
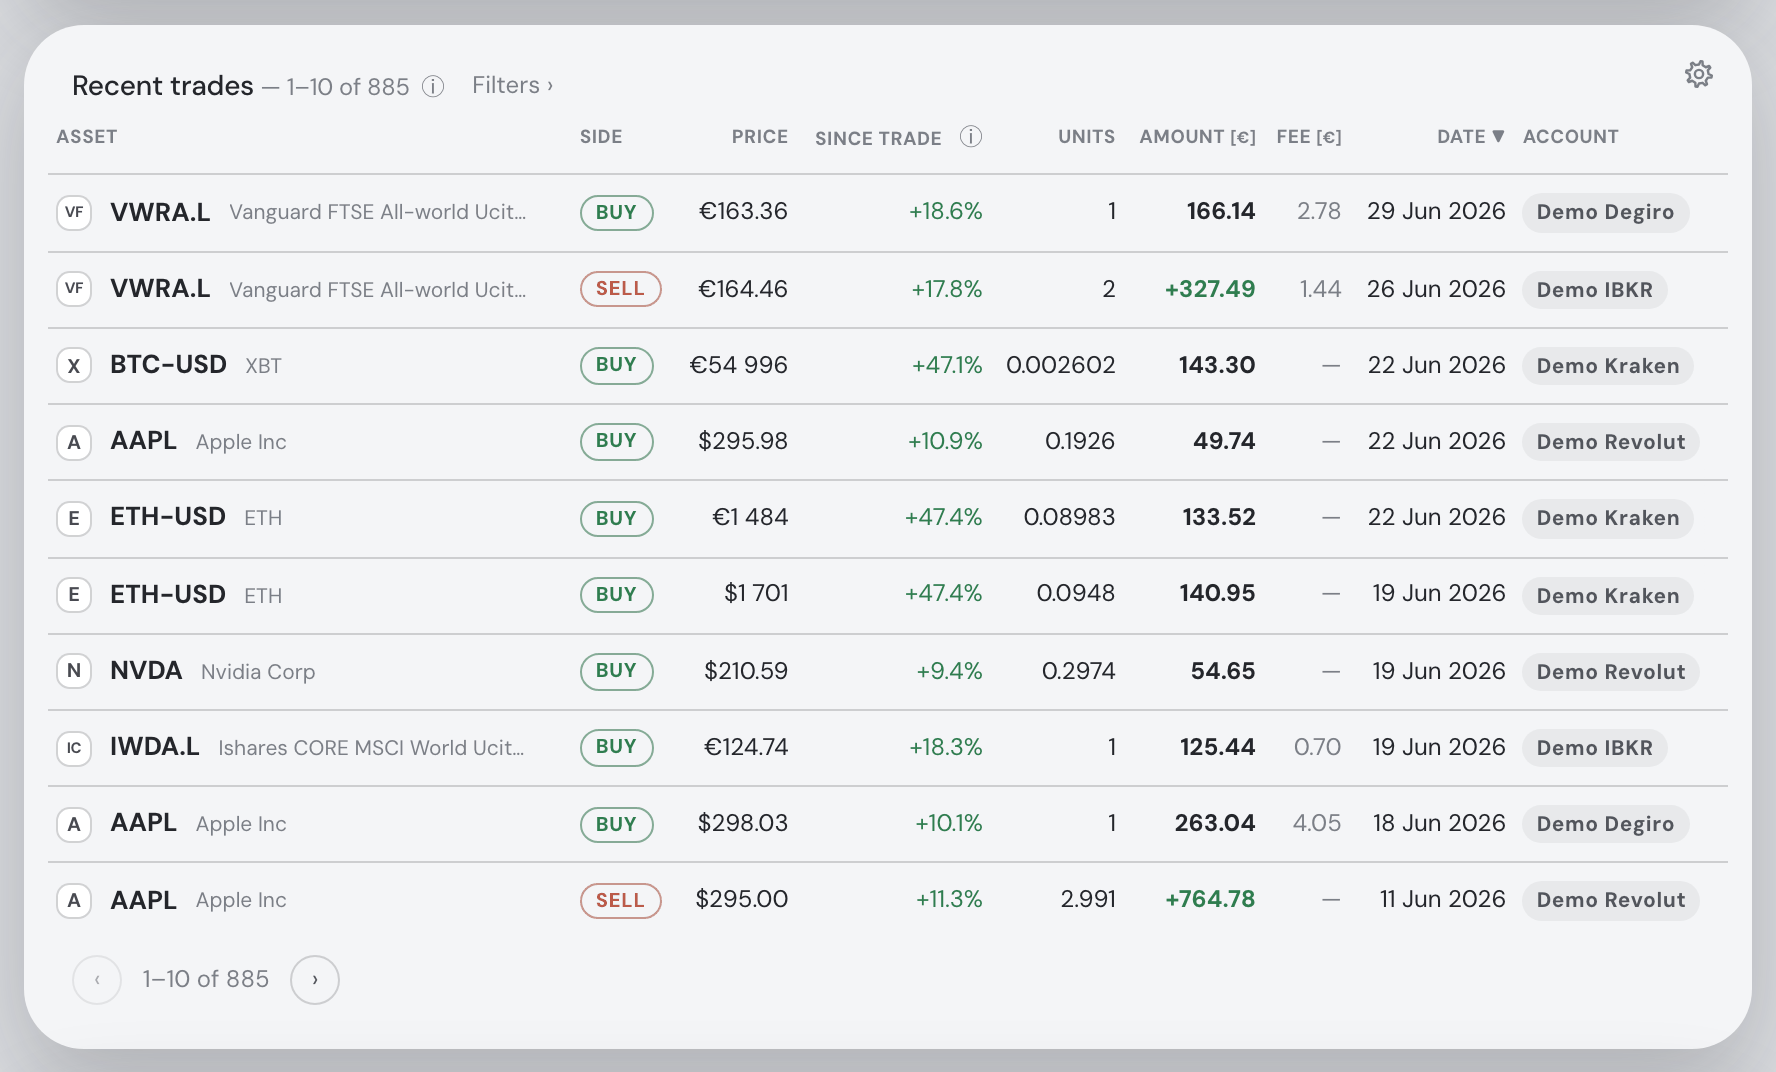
Directly under the trade plan, the Recent trades card lists your executed buys and sells across all accounts, newest first. Each row shows the asset, a Buy or Sell chip (green for a buy, red for a sale), the price in the trade’s own currency, Since trade, the units, the amount in your display currency, the broker’s fee where the export reports one, the date and the account. Click a row to open the asset’s details.
The amount is what the trade cost or raised, converted at that day’s exchange rate and including fees where the broker reports them. Sales are money coming in, shown in green with a “+”; purchases are money going out, in black (white in dark mode). Since trade is how the asset’s price has moved from that execution to today, in the asset’s own currency, so exchange rates do not affect it. Later splits are accounted for. For a sale it shows what the sold units would have done since. A dash means there is no current price.
The card shows 10 rows a page. The ⚙ in its corner sets 10, 15, 20, 50 or 100, and this browser remembers the choice. The ‹ and › buttons under the table turn the pages, as in the Explore tables, and the card’s title shows which trades you are looking at, for example “11–20 of 1396”. A new page size starts again from the newest trades. Broker exports record the date of a trade but not the time. Transfers between your own accounts, ledger corrections, staking credits and corporate actions are not trades, so they are left out.
Sorting. Click any column header to sort by it, and click it again to reverse the order. Figures start with the biggest and words run alphabetically; the table starts newest first. The sort covers your whole trade history, not just the page on screen: sorted by Amount, the first row is your biggest trade ever. Trades with no value in the column, such as no fee or no current price, stay at the end either way.
Filters. The filters are folded away under Filters › next to the card’s title. Click it to open them. They are the same filters as the Trade recommendations tables: a box for a name or ticker (put a phrase in quotes, like “dividend payers”, to let the assistant pick the matching assets), the Type chips, a Date range from one day to another (both days included), and under More filters buys or sells only and one or more accounts. Like the sort, they apply to your whole history. The title and the page buttons then count only the matching trades, a line under the title says how many match, and Clear filters removes them all. While the filters are folded, the label shows how many are on, for example “Filters › · 2 active”. Changing the sort or a filter goes back to the first page.
Money flow
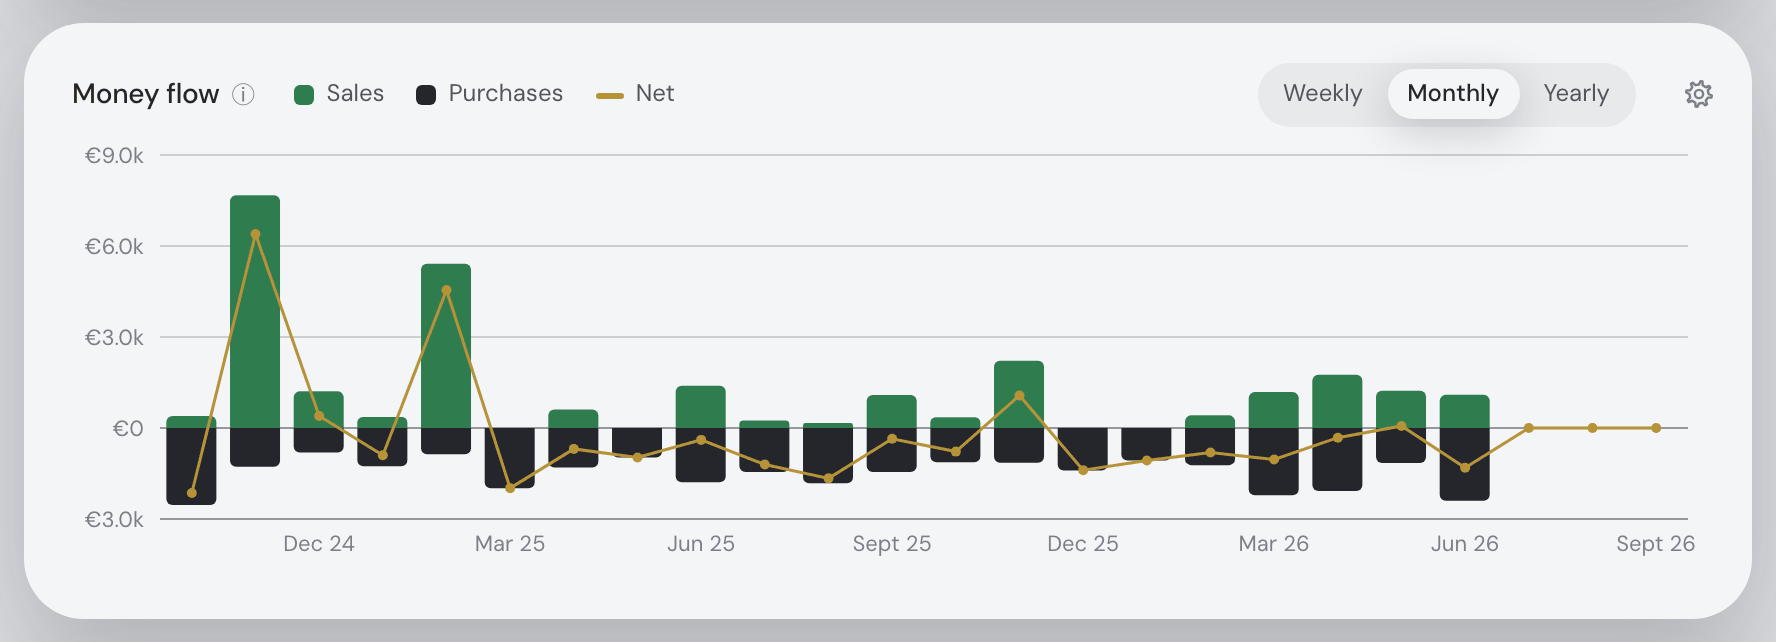
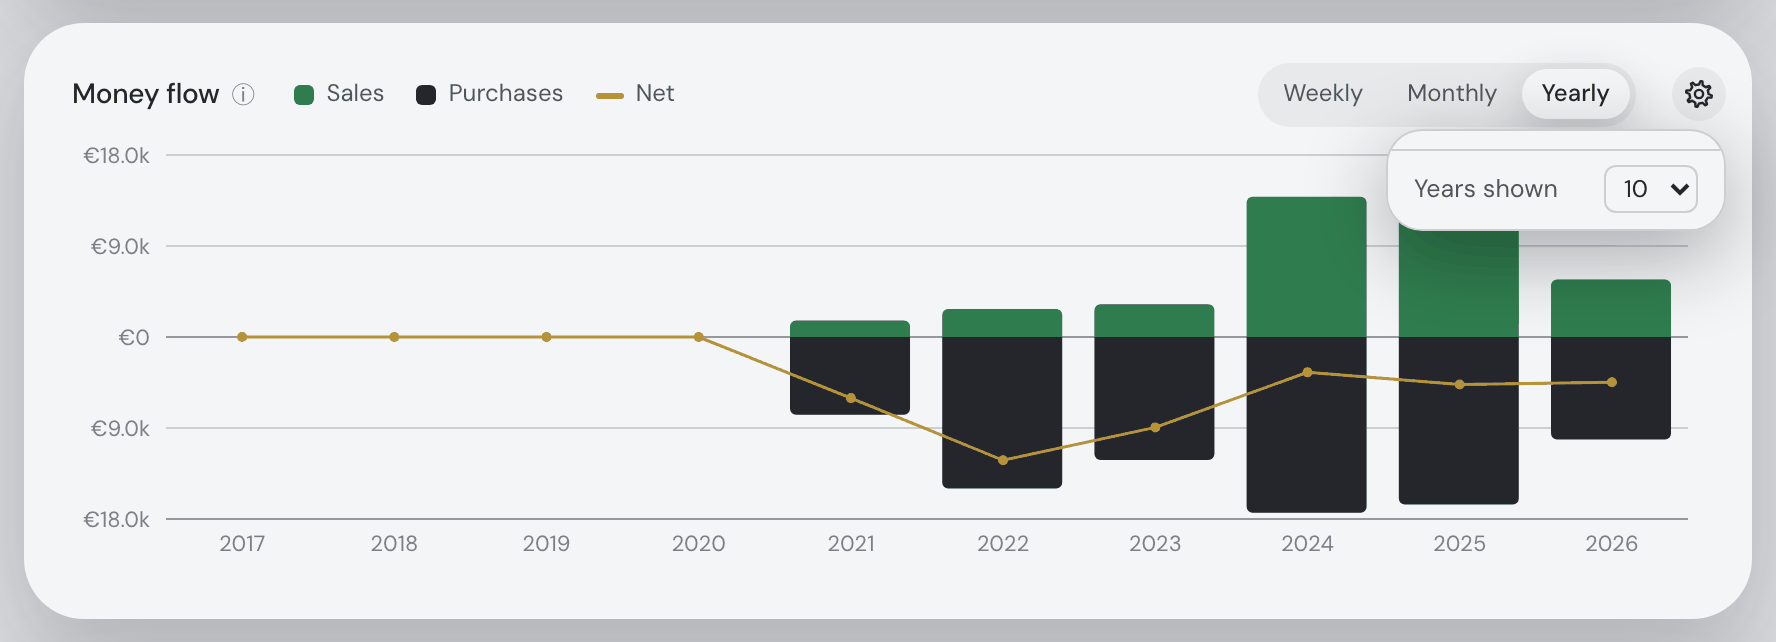
Under Recent trades, the Money flow chart shows how much went into purchases and how much came back from sales in each week, month or year. Use the Weekly | Monthly | Yearly switch to choose. The chart covers the last 26 weeks (starting on Mondays), 24 months or 10 calendar years (the current year counts up to today); the ⚙ in the card’s corner sets 12, 26, 52 or 104 weeks, 6, 12, 24, 36 or 60 months, or 3, 5, 10 or 20 years, and this browser remembers the choice for each. Amounts are in your display currency, converted at each trade’s own exchange rate. A period without trades shows as zero.
Sales rise above the zero line in green: cash inflows, what your sales brought in. Purchases hang below it in black (white in dark mode): cash outflows into positions, what your buys cost. Both are the broker’s cash amounts, with fees included where the broker reports them. The thin line with dots is the net: sales minus purchases, above zero when the period sold more than it bought. Deposits, withdrawals, transfers and dividends are not counted. Hover a legend key for its definition, or a period to see its sales, purchases, net and number of trades.
Allocation monitoring
Asset, sector and class targets show how your holdings compare with your chosen mix. These monitoring targets are separate from the planner’s explicit fund, crypto, stock and cash targets.
Rated candidates
Companies share one rating across buy and sell views. Each row separates the rating’s drivers from the reason it was included, omitted or capped. Refreshes use current data and show progress.
Buy candidates
Choose Owned + favourites, Owned only, or Favourites only, optionally limited to one watchlist. The choice is the buy table itself: only those companies are rated and listed under Buy candidates. Under Favourites only a company you own but have not starred gets no row and no rating — it is not a purchase candidate. Holdings remain the full Sell candidates list in every mode. Explicit fund/crypto targets are a separate buy source; the planner does not add example ETFs on its own.
Reading the table
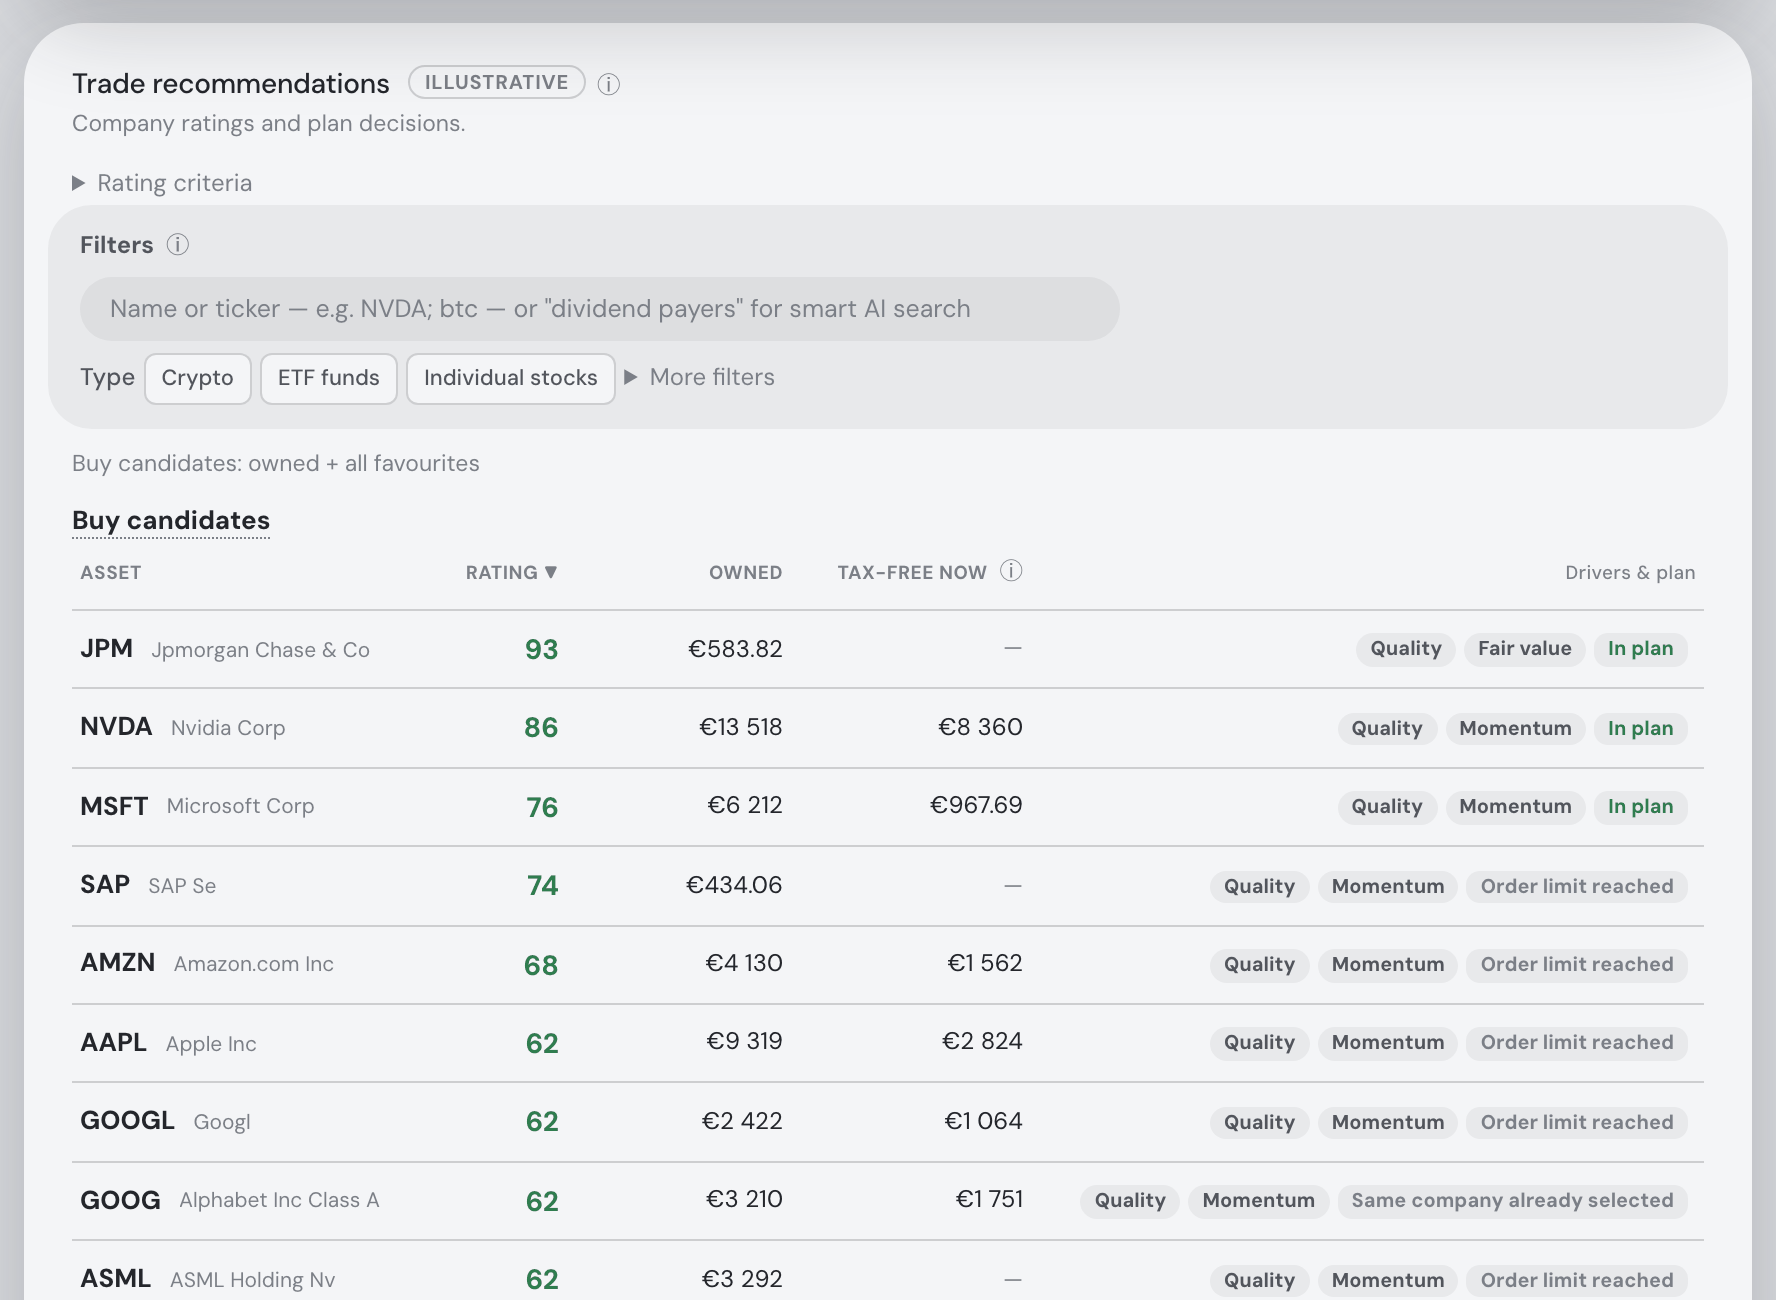
Rating is the company opinion; Owned is your current position; Tax-free now is the most of that holding you could sell today without income tax — the open lots already past the holding-period time test, at the current price. It is the same figure the Taxes tab shows as Tax-free value, and the trade plan’s Sell rows print it too. A dash means no lot has matured, or the asset has no tracked lots — on the trade plan’s Sell rows a holding with nothing matured yet says when its next lot does instead. The year’s small-sale exemption is a separate limit on total proceeds and lives on the Taxes tab. Illustrative, not tax advice. The leading criteria explain the rating. Plan reasons include Order limit reached, Insufficient data, Below minimum order and No budget. A fund/crypto target says Target allocation.
The company name is available on hover on narrow screens. Click anywhere on a row for its criterion values — except its ticker or company name, which open that asset’s own details instead, the same panel the heatmap, the search and your holdings open.
One tip per criterion. In an opened row, point anywhere on a criterion — its name, raw value, weight or score — and a single tooltip opens beside the pointer: first what this asset scored on, in its own terms (for Fair value, for example, “+18% vs fair value · 5 models”), then what the criterion measures and how its 0–100 scale runs — the same explanation the criteria weights give. Tabbing to a criterion’s name opens the same tip from the keyboard.
The headers explain themselves. Hover any column label — Asset, Rating, Owned, Tax-free now — and it says what the column holds and that clicking it sorts the table by that column. Click again to reverse the direction (Rating excepted — see below); the sorted header shows ▲ or ▼, and screen readers hear the same through aria-sort. Rows with nothing to compare — a candidate you do not own, or one the lot engine has no answer for — sink to the bottom in both directions rather than reading as zeroes. Drivers & plan explains itself too, and is the one column that does not sort.
Each table shows its top ten — the first ten rows of whichever column you sorted by, and nothing else. show all N opens the full list, show top 10 folds it back. A candidate the trade plan funded is marked In plan on its own row; being in the plan never adds a row from below the tenth. Rating sorts one way only — the way its list means: Buy candidates best-rated first, Sell candidates weakest-rated first. Clicking it again leaves the table as it is. Asset, Owned and Tax-free now sort both ways.
How the rating works
The rating is the weighted mean of available, positively weighted inputs. An actionable company rating needs at least three inputs, including Quality and either Valuation or Fair value. Missing inputs are shown, never counted as zero or as 50 — they are left out of the mean. All weights off means no rating. Only individual stocks are rated; funds and crypto get no company rating — and one of the curated gold ETCs the market data lists as a share (Xetra-Gold, SGLD, IGLN…) counts as a fund here, its row typed Commodities like a gold ETF’s.
Every criterion is a score from 0 to 100, where 50 is neutral. Each figure below maps onto that scale on a straight line between the two ends shown and is clamped beyond them. Hover a criterion in Rating criteria for the same explanation as a formatted tooltip.
| Criterion | Meaning |
|---|---|
| Quality | How strong the business is. The average of four reported figures: return on equity (0% or less → 0, 30% or more → 100), profit margin (0% → 0, 25% → 100), net debt ÷ EBITDA (4× or more → 0, no net debt or net cash → 100) and revenue growth (0% → 0, 25% → 100). A figure that is not reported is skipped; with none, Quality is left out. The Raw column shows the return on equity. |
| Valuation | How cheap the share is against its earnings and cash. The average of forward P/E (40 or more → 0, 10 or less → 100), PEG — forward P/E ÷ earnings growth in % (3 or more → 0, 0.5 or less → 100) — and free-cash-flow yield (0% or less → 0, 8% or more → 100). An expected loss and a PEG without positive growth are skipped. The Raw column shows the forward P/E. |
| Fair value | What textbook valuation models say the share is worth, against its price. Six models (DCF, Graham, Lynch, EV/EBITDA, dividend discount, sector P/E) are averaged with fixed weights, DCF the heaviest; a model that cannot run, or lands over 2.5× off the models’ median, is left out. Model value ÷ price − 1: −20% or less → 0, 0% → 50, +20% or more → 100. Not used in the historical backtest. |
| Analyst upside | Where analysts’ price targets sit against today’s price. Mean analyst price target ÷ price − 1: −30% or less → 0, 0% → 50, +30% or more → 100. Left out without a published target. Off by default; not used in the historical backtest. |
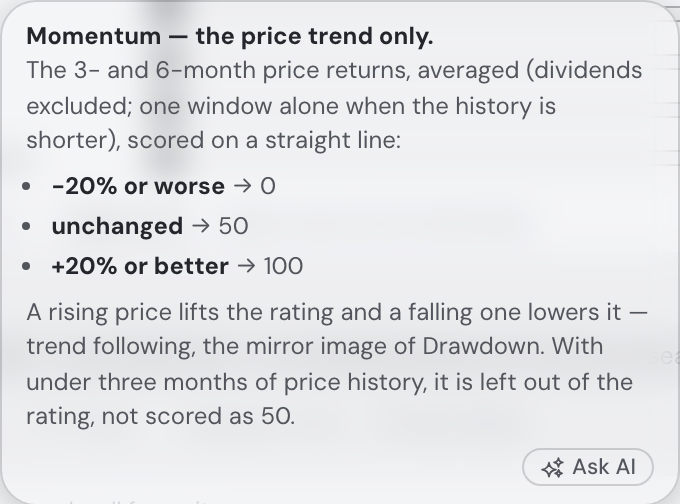
| Momentum | The price trend only. The 3- and 6-month price returns, averaged (dividends excluded; one window alone when the history is shorter): −20% or worse → 0, unchanged → 50, +20% or better → 100. A rising price lifts the rating and a falling one lowers it — trend following, the mirror image of Drawdown. Left out with under three months of history. |
| Drawdown | How far the price sits below its 52-week high. Today’s close against the highest close of the past year: at the high → 50, 35% or more below → 100. It never goes below 50 — buying the dip, the mirror image of Momentum. Needs at least five closes in the year. Off by default. |
| Dividend | The dividend yield, annual dividend ÷ share price: 0% → 50, 5% or more → 100. It never goes below 50, so it can only favour payers; with no reported yield it is left out. Off by default. |
| Group consensus | How many of the funds you follow hold it. The share of your followed Super Investors whose latest 13F filing includes the company: none → 50, all → 100. 13F filings are delayed (up to 45 days after each quarter). Needs Pro, Social and a followed fund with filings. Off by default; not used in the historical backtest. |
Criteria weights
Open the weights above the candidates. Defaults: Quality 40, Valuation 20, Fair value 20, Momentum 20; other criteria 0. Existing weights for retained criteria are preserved. Zero turns an input off. Apply changes or restore defaults.
Filters
Search names or tickers and filter by type, size or sector. Filters narrow the displayed rows; they do not change the saved plan.
Recommendation history
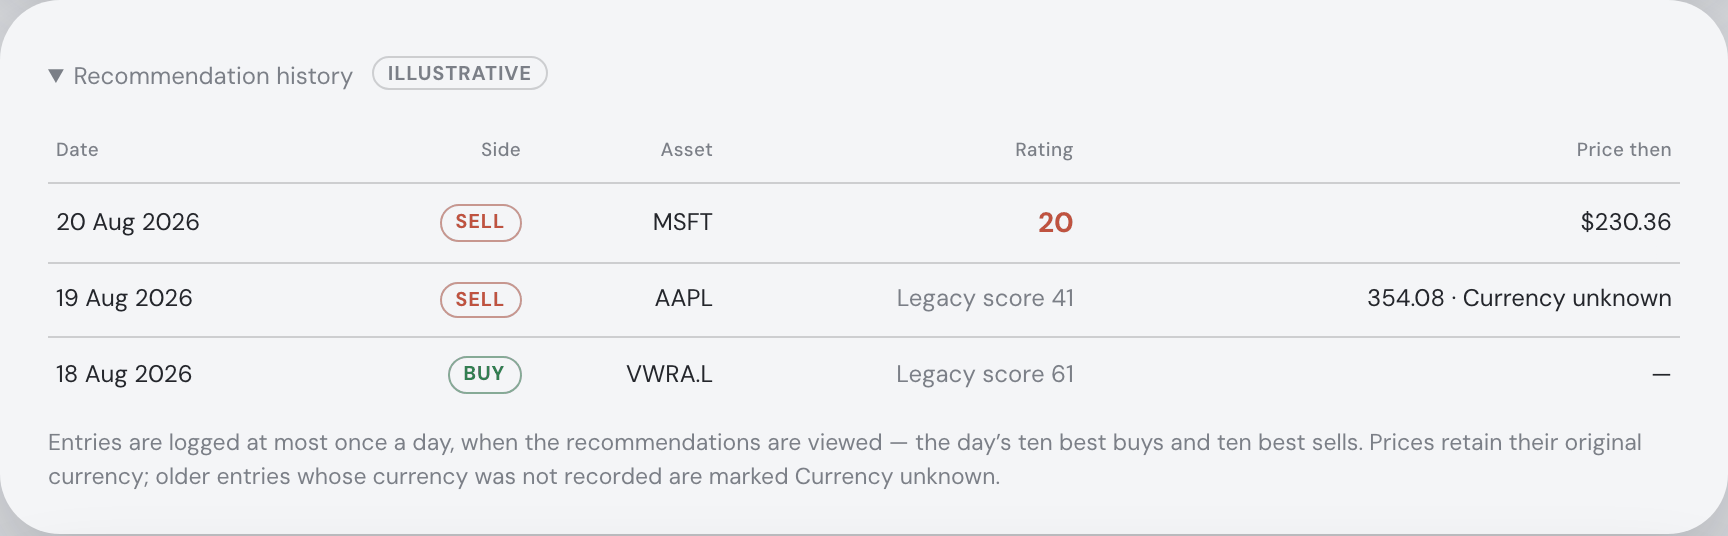
History records dated recommendations and prices, at most once a day. New entries identify the rating version; older buy/sell scores keep their original meaning. Each price retains its recorded currency, or says Currency unknown.
Trading activity
Expand the activity card for your executed buys and sells by month.
Using the assistant
Ask “Why was Delta skipped?”, “Limit each company to 10%”, or “Remove the company limit”. The assistant reads the same rating, decision reason and amount, and can change planner settings and targets. Assistant actions.
Group consensus
Available with Pro and followed fund filings. These delayed holdings are an optional preference input, not a forecast; missing filings leave the input unavailable.
Large exact optimizations
Exact tax optimization has workload limits. A refusal names the limit; choose FIFO explicitly or reduce the calculation. Spreadsheet and PDF imports likewise report processing limits.
Expanded buy and sell candidate lists keep show top 10 at the bottom of the visible list, above phone controls. Collapsing returns to that list’s start.